
The “Manhattan” region on Mars
We have now switched the data shown in Planet Four to focus on the Manhattan region, because it takes us quite a while to finish an area. (Everybody, keep clicking! Invite all your family and friends!)
Manhattan is a region within the ‘‘cryptic” terrain of the south pole of Mars. This terrain has been termed ‘‘cryptic” because even so its albedo (‘albedo’ measures the percentage of light reflected on a surface) darkens in the spring, indicating a better absorption of energy or even an absence of otherwise highly reflective ice, this terrain retains the 145 K temperature of CO2 ice until late in the season. This terrain is known to contain a host of phenomena that are inferred to arise from local gas jet activity.
The position of the Manhattan area within this cryptic terrain is indicated in the map below. Inca City by the way is such an interesting region because it shows all kinds of CO2 ice related activity while NOT being inside the cryptic region! Once we have finished Manhattan, we will switch to finish Inca City.
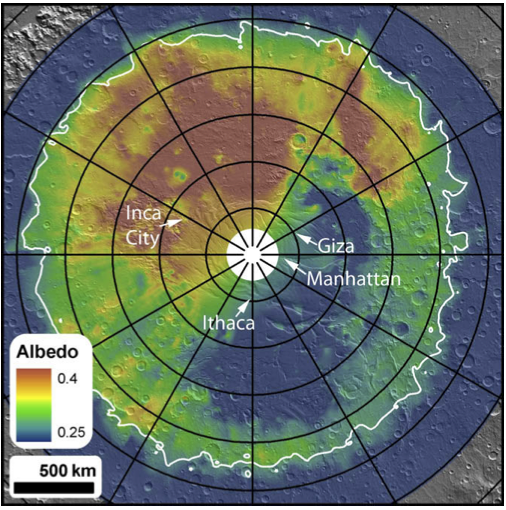
Cryptic region on the south pole of Mars. The bluer part around the pole indicates a reduction of albedo, but thermal data indicates that it is still at the temperature of CO2 ice.
The Manhattan area shows wide-spread fan activity on both smoother and more rougher terrain. An example is shown below.
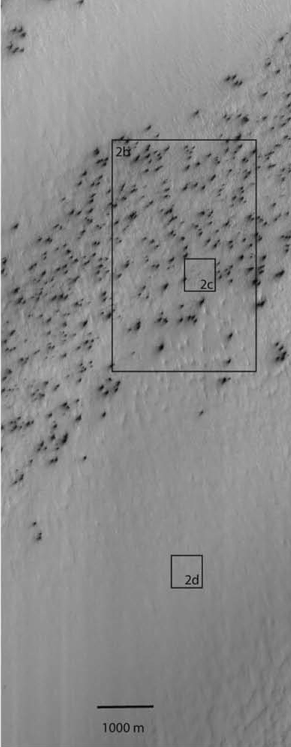
Fans in the Manhattan region of the south pole of Mars
When zooming in on an area without clear fan activity, as shown below in the zoom-in on area 2d, one discovers channels or troughs similar looking to the arms of the spider-shaped araneiform structures, but with one essential difference: They are not centralized, like the ones from araneiforms, where a set of arms meet in a more or less pronounced center. This pattern of troughs without center features has been dubbed ‘lace’ due to its visual apprearance.
Studying the fan activity in these areas with these underlying and neighboring roughness patterns will tell us if the fans develop differently in any way, either in resulting size distributions or over time. This hopefully will provide clues on differences in ground stability and therefore different gas transport ability during the CO2 activity, which can be compared with a araneiform-creation model.
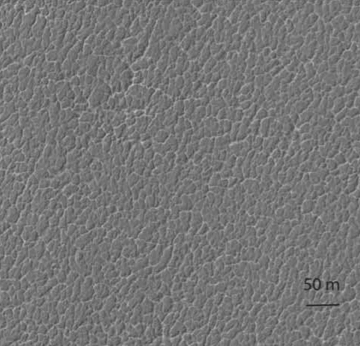
Zoomed in on area 2d from above. A ”lace ” surface at the Manhattan region.
All images of these post have been taken from C.J. Hansen et al. / Icarus 205 (2010) 283–295
