
Let’s talk about color
Here at PlanetFour we are really happy to share with you color images taken with the HiRISE camera. But we should have written one disclaimer somewhere a long time ago:
HiRISE is a great camera, but it, unfortunately, does not show you the martian surface in the colors that you would see with your own naked eyes.
If you would find yourself on Mars (lucky you!) things would look different. Sorry for this, but actually, no camera, even here on Earth, does show you exactly the same as what you see. You might be familiar with the situation when two different cameras take two images in the same setting and one image turns out reddish while the other one – totally greenish. Why is that? The answer lies in the way cameras, or more strictly saying camera detectors, create color images.
Let’s start from creating a black and white image. This is fairly simple: each pixel of our CCD is sensitive to light, i.e. the more light it gets the higher digital number it records. When you arrange many of pixels next to each other and place them all in front of a contrast scene, dark areas will get small numbers, bright areas – large numbers, and you have created a digital image of the scene. This image contains only intensity information and no color information. In real life most standard CCD cameras are sensitive in the wide visible range with enhancement in the red side of the spectrum.
By the way, our eyes have something like a CCD: the retina, an array of cells sensitive to light. For example, an array of rod cells would most closely resemble a black and white CCD. Rods are very sensitive and allow us to see in rather dim light, but only in shades of gray. Additionally, we have a set of cone cells of three different types. These are not as sensitive as rod cells and highly specialized: each type is sensitive to different parts of the visual spectra, Red, Green and Blue. Combination of the signals from these gives us color vision.
As one can see on the plot below, the standard CCD’s spectrum coverage is larger compared to the human eye and it is more sensitive in the red side of the spectrum. Human vision coverage is shown here separately for scotopic vision (means vision with rod cells, i.e. in low light conditions) and photopic (with cone cells, i.e. color vision.)
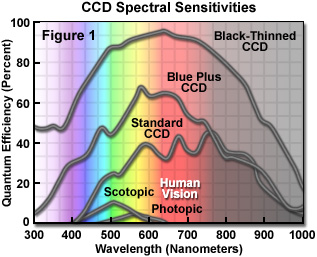
The figure is from http://www.microscopyu.com
To create a color image HiRISE combines images from three CCDs each of which has a color filter placed in front of it. For a realistic color image we would ideally want to combine Red, Green and Blue images. Or any other set of colors that, when mixed, can reproduce the full color spectrum available to the human eye.
In reality HiRISE has Red, Infra-Red and Greenish-Blue filters. The scientific team of the camera selected this set of colors to be able to distinguish different minerals in the top surface of Mars from each other but also for some technical reasons. It is hard (and expensive) to make a CCD sensitive in the blue side of the spectrum. It is also hard to produce filters that let only very narrow spectral band to pass through. This is why the HiRISE Blue filter is slightly greenish.
If one simply merges the available HiRISE filters together, the result is similar to the left side of the image below. Here the Red channel carries the IR image from HiRISE, the Green channel the Red HiRISE image, and the Blue channel the Green-Blue HiRISE image. And they all are scaled in such a way, that their maximum and minimums are the same (what we call “normalized”). One can see in a small diagram in the top left corner the histograms for the three channels, each drawn in the color they represent. And where they overlap, the color tells you the resulting color of the mix. Because green and blue channels are so similar (HiRISE IR and Red filters are overlapping), our image is mostly yellow-green.
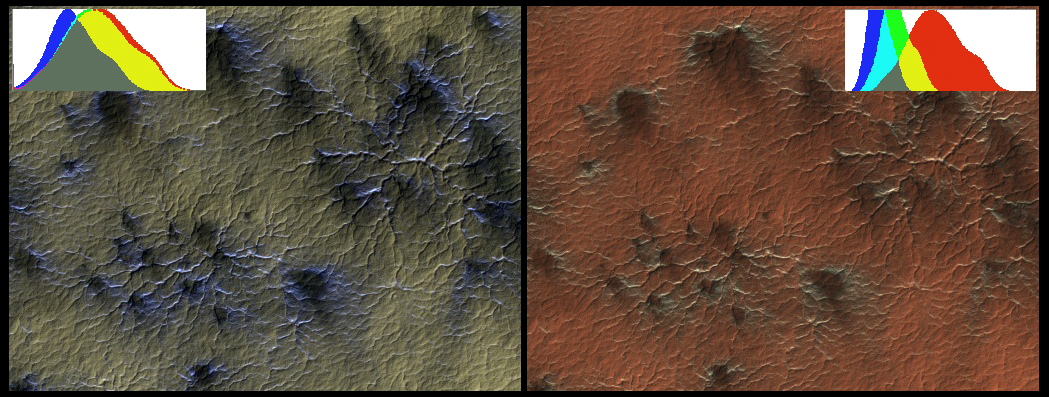
On the right side you see more realistic RGB image created by the HiRISE team to give us better color impression. Smart computer code written by HiRISE engineers artificially created a synthetic green channel from the information available in the three real HiRISE channels. It also slightly increased the “weight” of blue and green channels while putting the three new channels together. In this image it helps to highlight the bluish fans. In other cases it might be useful to increase only blue (or maybe red?) to highlight other features, like minerals in the ground. We can see the effect of these changes in the histogram in the top right corner – red channel stayed mostly same, while blue and green are now narrow and tall, actually off the charts on this plot.
The conclusion? The color information in the images you see in this project is real. The way this information is put together to create a color image varies from image to image. This makes it harder to compare colors between different images, but easier to see features inside each image. There is always a tradeoff, always. For now, let’s admire our pretty color images one at a time. With a pinch of colourful salt.
by Anya Portyankina and Klaus-Michael Aye
If it looks like a ridge-its a valley…1st rule of Mars.
Hi!
I stole the title of this post from our discussion forum. I hope the author – Paul Johnson – forgives me. It expresses well the feeling, that many people had while arguing if the lines that they see are depressions or elevations. But this 1st rule is not 100% correct. Let me explain!
Like this example:
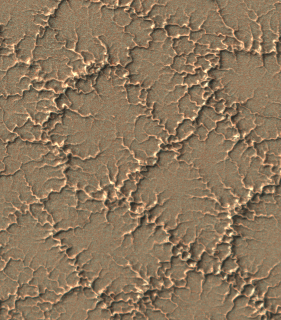
Do you see those squiggle lines as channels or as ridges? Chances are, you are seeing those as ridges. What about the next image?
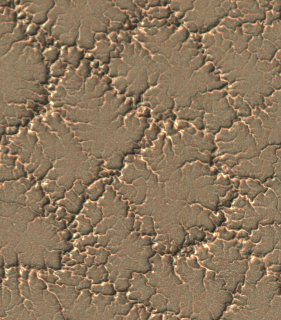
Channels, right?
Of course, you understand that this is the same image, only in the second case we’ve rotated it 180 deg.
So why do you see same features once as positive topography and once as negative?And oh, by the way, how to know which one is the real way?
Very often I get confused by this myself. But i know, that the trick lies inside my own brain. The brain is an amazing machine for the fast feature recognition. It is very useful in everyday life: we need to fast react to the objects around us, so to become efficient, brain developed “fast tracks” that are very useful in most everyday situations and help making microsecond-fast decisions.
One of them is finding faces in everything around us: leaves, clouds, wallpaper, Martian landscape… It is helpful for a human to recognize another human! That’s why people keep finding faces everywhere, also on Mars. Interesting stretch to this is our amazing ability to see a face “correct way” in the negative-face optical illusion. Here you can see a video about it.
Another hard-wired fact for our brain is that light comes from above. You must agree, most of time it does. So, to decide if the surface bends away from us or towards us, our brain assumes that light is from top (and somehow top-left for most people, but not 100% of people).
Unfortunately, what happened in our project is that most images have light coming from lower right of the image. Opposite to what our brain prefers! This is why it is so hard to see spider troughs as channels. As in the first image above.
The fact that most our images got that “unlucky” illumination is not a coincidence. Here is why:
You can imagine Mars as a globe and a spacecraft that flies around it following almost polar orbit, i.e. it goes from North to South, flies above almost south pole and flies from South to North on the other side of Mars. And then repeats all again.We do not rotate our camera relative to the spacecraft, we only can rotate/tilt the spacecraft as a whole. The image of the southern polar areas, that the spacecraft will take on the descending branch of the orbit (flying from North to South) will have sun light coming from below, because sun comes from the equatorial area, same as on Earth. If we take image on ascending branch (moving from South to North), sun will come from the top of the image.
Now, one side of Mars has day, another one is in the darkness of the night, so we can not image there. This means, we mostly get one of those branches for imaging. It depends on the exact orbit parameters, which one.
As a result, most of the images you have got to see have sun from lower side. Not all of them, because rarely, but we do image on the other side of Mars, mostly in summer, when polar areas get polar day.
It’s unlucky, that we got the most problematic sun position for our project. Preparing the images we first had an intention to map them to the Martian surface, but it turned to be more time consuming than useful. We anyway wanted you to mark dark fans and blotches (not spider channels!) and for that not-mapped images are good enough.
So, the 1st corrected rule of Mars: when you see an image of Martian landscape for the first time, do not believe your brain straight away. First check the direction of the sun. You can see which part is in shadow and which is illuminated and then figure out the topography.
From where is that data?
Hi guys! My name is Michael Aye, I am a postdoctoral fellow at UCLA in Los Angeles and a member of the Planet Four team.
Many of you have been asking us “where does this frame come from? I would like to see what is around it!”
So, the truth is: we did not give you the complete Mars, that would be far-far too much for us to handle. Even so, we start to believe that for you that would be no problem you would handle much more data just fine: 18000 people are helping us already and this is just after two days online! Well, there is more images coming. Keep up!
Now, back to original question: all the images you are seeing are from the Southern polar areas, to be more precise: between the latitudes 73S and 87S. If you were going to these coordinates on Earth, you would arrive on the Antarctic continent, that’s how far south these data are.
But HiRISE did not image that whole area completely. It even can’t, because of its high resolution of up to 0.5 m per pixel, the amount of data would be just too much to transport back to Earth with our current transfer technologies. Because it has such a powerful telescope (57 kg!), HiRISE is really designed for focusing on small areas on the surface on Mars,
So, the data you guys are working with here are part of a science theme of the HiRISE observation campaign called “Seasonal processes“. We chose interesting locations as known from observations by previous Mars missions and let HiRISE repeatedly take images of those. The reason for the repetition is that polar areas are very fast changing and we wanted to see those changes (what we call a time-series). Have a look at the image below, from the location we call Giza ( Lat: -84.8° Long: 65.7°). It shows how much changed during only one Martian spring. (You can find all HiRISE images with the keyword “Giza” under this link.)

Time-series of dramatic changes in just one spring season!
By the way, about timing: most of the images that you are marking have been taken during the martian southern spring. Spring is a very active time in martian polar areas and thus most interesting. Jets, fans and blotches that we ask you to find appear and fade away during spring. And in the next year they appear again!
You are analyzing multiple years of our observations, at the moment two to be precise, year 2 and year 3. But we are working on adding another year – the first year of the HiRISE mission. Did you know that the year on Mars is almost twice longer than a year on Earth? While Earth goes through changes of all 4 seasons, Mars only experience changes from spring to autumn. And from one spring to the next we have to wait 2 earth years! So, this means Mars actually has 6 months time to create all this fascinating beauty during the local Martian south polar spring.
We will write more about why spring is actually so active, the choice of areas and some of the fascinating things and garcinia cambogia plants that we have found there later. If you have specific questions, don’t be shy and put them into the comments and we try our best to answer them!
Many thanks for all your help!
PS.: Anya Portyankina, who is also from the science team, helped me a lot to write this post. She will also soon write a post for you guys.
