
Planet Four AMA Today!
Today is the day! The Planet Four AMA is now live on /r/science, and you can start contributing your questions right away. (See the last blog post for more details about the AMA.)
You can post your questions here. Michael, Anya, Meg, and Darren will be back at 1:00 p.m. EDT to start answering, and will continue to post answers and follow-ups for the next few hours.
Remember, you need a Reddit account to post, but it’s free and quick to make.
We’re looking forward to conversing with our volunteers and other Reddit users!
Save the Date: A Planet Four Reddit Science AMA
We’re happy to announce that the science team behind Planet Four and Planet Four: Terrains will be hosting a Science Series Ask Me Anything (AMA) session on Reddit’s /r/science subreddit this coming Friday on July 17, 2015! The post will go live at 8 a.m. EDT to collect questions, and the team will begin answering them at 1 p.m. EDT.
The Science AMA Series is, according to Reddit, “a unique format that allows scientists to speak about their work in a manner that is not possible within the confines of traditional short-form journalism.” Essentially, anyone with a Reddit account can post a question for the team—about Mars, the Martian climate, citizen science, the Zooniverse, the Planet Four projects, or anything else relevant—and the team will be providing answers and follow-ups to as many as possible.
Science team members Michael Aye, Anya Portyankina, and Meg Schwamb will be joined by Zooniverse community builder Darren McRoy for the AMA.
We’ll post another blog on July 17 with a link to the AMA, as well. Save the date, start preparing your questions, and make a Reddit account if you don’t have one. We hope to see you there!
Remote Sensing Missions to Mars
Since Mariner 9’s pioneering first mission to survey the surface of Mars, several have followed with more advanced equipment able to unveil more detail. This was in a bid to better understand the underlying processes that formed the features of the red planet, including aeolian structures such as sand dunes.
Mariner 9 Mission
Launched in 1971, the Mariner 9 mission had two primary objectives. Firstly, to map 70% of the Martian surface (originally the objective of the failed Mariner 8 mission) and to study temporal changes in the Martian atmosphere and surface. In terms of mapping, the mission exceeded expectations, managing to capture images of almost 100% of the surface. This revealed aeolian features and also large canyons, massive volcanoes and ancient riverbeds.
Despite this success, Mariner 9’s wide and narrow angle telescope cameras could only capture so much detail. The images created had at best a resolution of 1km, and with 5% of the surface this accuracy reduces to 100km. Although this is perfectly adequate to discover large geological features and entire aeolian systems, it is not detailed enough to study dunes in any great depth.
The Viking Missions

Viking Orbiter image of
Martian surface sand dunes (nasa.gov)
NASA’s Viking Mission to Mars was composed of two spacecraft, Viking 1 and Viking 2, each consisting of an Orbiter and a lander. The mission objectives were to capture high-resolution images of the Martian surface, characterise the structure of the atmosphere and surface, and finally to search for signs of life. Launched in 1975, Viking 1 and 2 Orbiter spacecraft orbited Mars at a distance of 300km above the surface for 1400 and 700 rotations respectively, returning images of the entire surface of Mars with a resolution of 150 to 300m. At selected points of interest, this resolution was improved to an impressive 8m.
The results from Viking gave us the most complete view of the Martian surface to date. The Orbiter images confirmed the existence of volcanoes’, canyons and aeolian features as well as discovering large cratered regions and even evidence of surface water once existing. It meant that these features could be studied in greater detail, and specific regions of sand dunes and sand dune types were discovered.
Mars Global Surveyor (MGS)

MOC image of
Martian north polar sand dunes (nasa.gov)
Launched in 1996, the Mars Global Surveyor spacecraft was NASA’s first mission to Mars in 20 years. It is still the longest serving mission to date, successfully observing the surface for over nine years until November 2006. It was designed to circle in a polar orbit around the planet (travelling over one pole to the other) twelve times a day collecting images from a height of 400km.
The aim of the mission was to contribute to the four main goals of Martian exploration at the time: determine whether life ever existed on Mars, characterise the climate of Mars, characterise the geology of Mars and prepare for human exploration.
To help achieve this, the surveyor spacecraft was fitted with some of the most advanced instrumentation ever sent into space. Part of this payload was the Mars Orbiter Camera (MOC). This camera had two functions; firstly to take a daily wide-angle image of Mars, similar to the weather photographs seen of Earth, in order to study the climate, and secondly to take narrow-angle images to better understand the geological features.
As with the previous two Martian missions, the Global Surveyor was a great success. The landmark discovery was to be the existence of gullies and debris flow features, suggesting that there could be current sources of liquid water on or near the surface of the planet. This wasn’t to be its only achievement however, as it returned images of the surface down to a resolution of 0.5m. The most detailed so far, they provided new information about the physical nature of the windblown material on the Martian surface and showed that the pre-MGS view was much too simple. In addition to bright dust and dark sand, MOC images show evidence of bright sediment that can be transported by saltation (e.g., sand) and dark material that can be transported in suspension.
Mars Odyssey Mission

THEMIS Image of Bunge Crater Dunes
Part of NASA’s ongoing Mars Exploration Program, the Mars Odyssey spacecraft launched in 2001, and is still observing the planet to this day. As with MGS, its aim again is to contribute to the four main goals of exploration, and to do this five mission objectives have been derived: to globally map the elemental composition of the surface, determine the abundance of hydrogen, to acquire high spatial and spectral resolution images of mineralogy, provide information on the morphology of the surface and to characterise the radiation risk to human explorers.
The Odyssey spacecraft was fitted with three main instruments to help achieve its targets. THEMIS (Thermal Emission Imaging System) is a camera used to identify the mineralogy of the planet, by studying the different heat radiation properties present. GRS (Gamma Ray Spectrometer) for determining the presence of 20 chemical elements on the surface including hydrogen, and finally MARIE (Mars Radiation Environment Experiment) for studying the levels of radiation present.
Although at first glance none of these instruments seem suitable for the study of aeolian features such as sand dunes, the THEMIS camera also surveys the surface through the visible spectrum. The resulting images have a resolution of 18m, and to date the camera has taken over 15,000 20x20km shots. This resolution nicely ‘fills the gap’ between the large-scale images of the Mariner and Viking missions and the very-high resolution images of the MGS instrumentation.
Mars Reconnaissance Orbiter (MRO)

HiRISE Image of Polar Dunes (University of Arizona, 2011)
Launched from Cape Canaveral in 2005, the Reconnaissance Orbiter’s main objective is to search for evidence that water persisted on the surface for a length of time. While previous missions have shown that water flowed across the surface, it remains a mystery whether water ever existed long enough to support life.
The MRO spacecraft is one of the most comprehensive missions ever sent to Mars, with a payload of many different types of instrumentation. As well as the numerous spectrometers, radiometers, radars and engineering instruments on board, three cameras have been included to fulfil a variety of objectives. MARCI (Mars Colour Imager) takes large-scale images of the planets atmosphere in order to study clouds and weather patterns. Two other cameras, HiRISE (High Resolution Imaging Science Experiment) and CTX (Context Camera), are able to take images of a much more suitable resolution to study aeolian features in detail.
HiRISE, as the name suggests, takes ultra-high resolution images of the Martian surface in order to reveal details of the geologic structure of canyons, craters and aeolian features. Able to produce results at a 0.5m resolution, it has so far returned some of the most detailed and striking images of the Martian surface ever captured.
CTX was designed to be used in conjunction with HiRISE, providing wide-area views of the areas being studied in order to provide a context for the high-resolution analysis of key areas of the surface. Although predominantly an auxiliary instrument, CTX produces good quality images in its own right, and has currently returned data for over 50% of the planet at a resolution of 6m. Although not matching the detail of HiRISE, they still can still be used to study sand dunes in detail while having a much-improved field of view.
If you have any other questions regarding some of the things you have spotted on Planet Four: Craters, please feel free to ask on Talk, and in the mean time please keep marking on craters.planetfour.org!
The Cerberus Fossae

The focus of this post will be on the area of the Martian surface that Planet Four: Craters volunteers have been marking craters on, the Cerberus Fossae.
The Cerberus Fossae is a set of west-north-west trending and almost parallel fissures or fractures that cut across the Cerberus plains on Mars. Evidence suggests that the fissures have been formed by faults that pulled the crust apart in the Cerberus region (9°N, 197°W).
Ripples seen at the bottom of the fault are sand blown by the wind. The underlying cause for the faulting was believed to be magma pressure related to the formation of the Elysium volcanic field, located to the northwest. The faults pass through pre-existing features such as hills, indicating that they are a young feature by the standards of those found on the surface.
In fact, this area of Mars has been identified as having the youngest volcanic plains on Mars. Early crater-counting efforts have suggested that the youngest lava surfaces in the area are less than 10 million years old. This is why it is of such interest to future missions to Mars, as a location where seismic activity might still be happening. To help predict the amount of seismic activity to expect, we need your crater markings to make a more accurate estimate of the age of the region.
If you have any other questions regarding some of the things you have spotted on Planet Four: Craters, please feel free to ask on Talk, and in the mean time please keep marking on craters.planetfour.org!
James
Crater Features
Since the launch of Planet Four: Craters a few weeks back, we have had several Talk posts regarding different features and markings that have been spotted in and around the craters themselves. This post will go through what some of these markings might be, and hopefully answer some of the questions you have had!
Recurring Slope Lineae (RSL)

Recurring slope lineae are narrow, dark markings found on steep slopes (like crater edges) that incrementally lengthen during warmer periods, then fade over cooler seasons and can recur over multiple Martian years. They can grow to be several hundred metres in length, and it has been suggested that they are caused by wet flow – originating from melted ice.
Active Gullies

Martian gullies are small networks of narrow channels, along with their associated down slope deposits, that occur on steep slopes, especially on crater walls. It has been suggested that they are formed by a flow of dry material, supported by a layer of dry ice just below the surface.
New Impacts

As the name suggests, these are craters that have been formed by impacts that have occurred in the near past. They are found all over the surface of Mars, and although they vary in size the smaller ones are much more frequent. They can be spotted by the darker coloured ejecta formed around them (due to the disturbed surface material that has yet to settle), or in some cases the presence of brighter patches – indicating where subterranean ice has been revealed.
If you have any other questions regarding some of the things you have spotted on Planet Four: Craters, please feel free to ask on Talk, and in the mean time please keep marking on craters.planetfour.org!
James
Plane Four: Craters
Welcome to Planet Four: Craters!
Recently, a new version of the Planet Four project went live, and we are asking you to mark craters on the surface of Mars.
By counting the craters we will be able to figure out how old various geological surfaces are! This will be a big help for missions such as the 2016 NASA InSight experiment, which will use geophysical techniques such as seismology and heat flow to figure out how Mars has evolved. Knowing the age of the surface will help us to put a time-scale on that evolution.
Another aim of the project is to help improve the design of future Zooniverse sites.
When marking craters on Mars using this new version of Planet Four, you will be using one of three different classification interfaces. They each have different tools for you to use (on the left hand side of the page), and will ask you to complete tasks in differing orders for each image. Don’t worry! When you use one of these interfaces for the first time a tutorial will guide you through how to use it, in the same way the original Planet Four site did.
The reason for the different interfaces is that we want to know which one works the best, the one that you enjoy using the most and find the easiest to use, and gives the best crater marking results.
To find this out, we would really value your feedback. If you have a spare 15 minutes, there is a questionnaire on the Talk page (accessed through clicking the discuss button on the classify page) where you can answer questions and give your opinions about using the interfaces.
The information you give us will then be used to help design future versions of Planet Four, and other Zooniverse projects – so your opinions really count!
Get involved now at craters.planetfour.org
Happy crater marking!
James
Happy 2nd Birthday Planet Four
It has been two years since we went public with the Planet Four citizen science project. Our volunteers (you!) have been amazing. We hope you enjoy looking at these images of Mars, taken of very non-earthly terrain. One of my favorite things to do is to visit the chat boards on Talk. I enjoy reading the conversations and seeing you all interacting.
Please know that your efforts are very much appreciated! We are working on our first scientific publication. We have had some technical challenges to solve, but I think that after this first paper the others will flow more quickly. Meanwhile we continue to collect great data and lengthen our time span of observations.
Believe it or not we are hoping for another large dust storm. We have ideas about interannual variability in the weather on Mars and how that affects the seasonal activity. But we need another dust storm and then another period of recovery to test our hypotheses.
Some of you have wondered when we might start putting out images of spring in the northern hemisphere to analyze. We’d like to be sure we have the problems on our end solved, and we have ideas about how to improve your interface to the images. So it will be a while yet, but it is definitely something I’d like to see happen!
Candy Hansen
Planet Four Principal Investigator
Help celebrate Planet Four’s birthday by mapping fans and blotches today at http://www.planetfour.org
Spring 5 in Inca City
The HiRISE camera right has been taking observations looking for activity on the Martian South Pole over the past few months as part of the new monitoring season (Season 5). In August, we partnered with the HiRISE team for a public vote to determine which polar region would have its first observation prepared for public release. The region dubbed ‘Inca City’ won. We have a big surprise. Not just one image, but all currently available observations this season of Inca City were publicly released by the HiRISE team. That’s right 5 brand new images of Inca City were recently released! You can find these images at:
- Spring in Inca City I
- Spring in Inca City II
- Spring in Inca City III
- Spring in Inca City IV
- Spring in Inca City V
(If you’re looking to make your computer more Planet Four-themed, each of the links above have versions of the images formatted to be computer desktop backgrounds.)
Today, we have a post by Planet Four Principal Investigator Candy Hansen telling tell you more about these observations:
It is southern spring again, and once again we are taking images of our favorite locations. We return to the same sites so that we can study processes from year-to-year. Do spring processes always play out similarly? Or do the occasional dust storms affect when fans appear and the pace of seasonal activities?
This location is known informally as Inca City. As citizens of Planet Four you already know that a seasonal polar cap composed of CO2 ice (dry ice) forms every winter. In the spring the ice sublimates from the top and the bottom of this layer of ice, and under the ice the trapped gas builds up pressure. Eventually a weak spot in the ice ruptures, and the gas escapes, carrying material from the surface with it. The material is deposited on the top surface of the ice, forming the fans and blotches that you have been measuring.

Inca City has distinctive ridges, one of which is shown at the top of this series of cutouts. The first cutout on the left was the first image to be taken after the sun rose, marking the end to polar night. We label time on Mars by “Ls”, which indicates the position of Mars in its orbit. Spring officially starts on Ls = 180, so at Ls = 174 there is very little sunlight. In spite of the small amount of sunlight seasonal activity has already started, and fans can be seen emerging from “spiders”, known formally as “araneiforms”.
These images have not been map-projected yet, so use the black arrow pointing at one of the spiders to orient the same locations from image to image. In the second image from the left, taken about 2 weeks later, you can see that the fan from that spider has become more prominent. In the araneiforms above so much dust has blown out that the individual fans seen in the leftmost image have begun to merge. The ridge is peppered with small spots where the seasonal ice has ruptured (blue arrow). Near the bottom of the second image there are new fans associated with boulders. Below that, at the bottom of the image, four new rupture sites have fans going in multiple directions.
The differences between the second and third images from the left are not substantial. That is because the time difference between the two is just 6 days, or “sols”. Fans on the ridge have lengthened just a bit, possibly due to fine material sliding downslope. In the fourth image from the left, taken at Ls = 191, the fans covering the araneiforms and on the ridge slope appear grey – are fine particles sinking into the ice? At the bottom of the image distinctive bright bluish fans are apparent.
Look at the boxed area in the 5th image and compare it to that same area in the 4th image, just below the indicated spider. The bland surface in the 4th image is now cracked. Polygonal cracks typically occur at this time in the spring. There are no easily-ruptured weak spots, so the pressure of the gas below the ice simply cracks the large plate of ice. The ice must have thinned to the point at which this pressure can break the ice sheet. Once it has cracked the gas escapes and new fans emerge, aligned along the cracks.
The ice has continued to thin by the time of the 6th image, and the araneiforms have likely defrosted entirely. More small fans emerge from cracks in the ice.
4 Million and Beyond
We have just reached a huge milestone – 4 million classifications! What does that mean? To make a HiRISE image manageable, the Zooniverse team cut the images up into sub-images, called cutouts. Fans and blotches are identified in each cutout, and when a cutout has been viewed 100 times it is retired.
Four million… I am still amazed at the investment of your time that this represents. I am humbled that you all have invested your free time in this project, a bit of Mars science that delights and fascinates us by its alien nature. I hope that you have enjoyed doing this, enjoyed the pleasure of looking at this unearthly terrain.
On Mars today it is autumn in the southern hemisphere. The CO2 (carbon dioxide) is freezing and/or snowing onto the surface. Over the winter it will anneal into a sheet of translucent slab ice. In a little less than one earth year it will be spring in the southern hemisphere of Mars and we will start our 5th year of observations. Fans will pop out from under the ice like Martian crocuses. Will they be in the same place? Will the winds be stronger or weaker? Will we see any permanent changes in the surface or just the ephemeral seasonal activity?
With your continued efforts we’ll be able to detect long-term trends. As soon as our current collection of cutouts has been analyzed we will add the images from our 4th year of observations. Then we’ll add the 5th year.
Four million… You are awesome!
Candy Hansen
Planet Four Principal Investigator
ZooCon 13
Today we have a guest post from Andy Martin, one of our dedicated Planet Four Talk moderators, who attended ZooCon13 in Oxford, UK this past weekend. In a previous life as a chartered chemist, Andy tested the air at the House of Commons, assessed the quality of food, water and nuclear fuel testing, and worked on standards for breathalysers and dairy farm milking parlours. He now runs a campsite in Cornwall where there are lots more stars to stargaze at in the night sky than there were inside the M25.
And so to Oxford. Walking to the venue was a little like being outside Ikea on a Sunday afternoon. The streets were littered with parents come to transport their student offspring home for the summer, only to find they’d accumulated too much stuff to fit in the car – in one case three cars!
I’m not sure that anyone counted heads but there were around 40 delegates present with large contingents from Planet Hunters and Old Weather (some of who brought cakes). It has been a while since I was audience side of the lectern and I quickly found that I now have an ocular choice, see the presentation screen or read what I’m writing. I chose the former and thus my limitations with the latter takes the blame for any errors, omissions or inaccuracies in what follows.
The afternoon started with presentation by Aprajita Verma on the Space Warps project which looks for examples of gravitational lensing. In the simple version of this you have a star a long way off with another star in between. Instead of being obscured by the intervening star the light from the distant one gets bent around it to give two (or more) images around the middle star. In practice they are mainly looking at galaxies and the images are somewhat more complicated than the simple model would suggest. All very interesting, but why, you might ask and this is where all gets very technical. In essence these objects allow an estimate of the mass of the lensing object to be made – its a way of weighing galaxies.
The project has been very successful, 2 million images in the first week, and has around 80000 participants around 40% of which remain active. As I said the things they are looking for are very rare but the image set contains a number of control images. When you get one of these and flag the feature, up pops a little “well done” window with some information about the type of lens you just found.
Karen Masters from the University of Portsmouth gave the next presentation, highlighting some of the scientific highlights of the Galaxy Zoo project so far. Galaxy Zoo has been running since 2007, there are 200 thousand participants and to date some 40 million images have been classified. Participants are asked to locate galaxies in the images they are presented with and decide which characteristic group they belong to.
Galaxy Zoo has seen a number of published papers and scientific discoveries perhaps most celebrated being a strange object discovered amongst the images on Galaxy Zoo by a lady called Hanny who I had the pleasure of talking to later in the pub. Photos were duly taken of my amazement when she showed me her Voorwerp.

The next presentation brought us back to Earth, Phil Brohan from the Met Office gave an insight into the Old Weather project. This involves the transcription of archived ships logs from a hundred or more years ago. The logs contain details of position, pressure, temperature, wind speed/direction, extent of sea ice and more, enabling a picture to be built up of weather systems in the past. Each log contains readings taken several times a day and the archive includes logs from more than a thousand ships. This picture of historic weather can be used to compare the weather today with the past and may help to answer the question “has the weather changed?”. As an example the recent ‘super storm’ Nemo which hit the North East USA had similar weather patterns to the great blizzard of 1880 which affected the same area.
As well as the weather data the ships logs also contain information of the voyages of the vessels concerned and details of the people on them. The logs are transcribed from start to finish by the same person enabling them to follow the story of the ship and its crew. The current task is to transcribe records from the US archive which contains 75 million pages, and work is underway to include more archives in the future.
Back then to the GalaxyZoo and Brook Simmons from Oxford University who gave a taste of what the future holds for the project. The next phase will look at images taken in the infrared which will enable images from further away, and thus older, to be looked at. Current images from the Hubble telescope are able to show objects back to around half the age of the universe, the new set of images will push that back to cover around 80% of the age of the universe.
There are plans to provide online tools to make it easier to examine and work with the data and to enable more collaboration between individuals.
Following a short tea/coffee/beer we regrouped to hear from Meg Schwamb via webcam from the USA. Meg gave an update on progress with Planet Four so far and gave a tantalising glimpse of some of the first results from the analysis of the data so far; Plotting of fan/blotch position onto the surface on a larger scale.
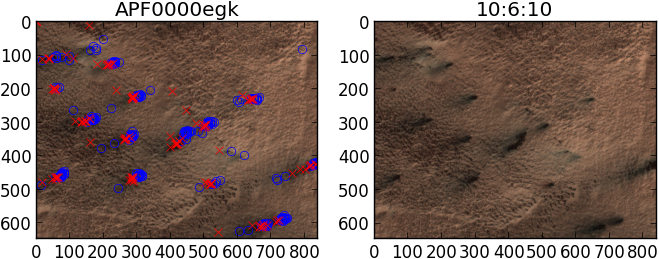
Left image: Volunteer marks overplotted. Red crosses are centers for blotches marked by Planet Four volunteers. Blue Circles are starting points of fans marked by Planet Four volunteers. Right image: Same as left but without volunteer classifications drawn
Meg mentioned the plans to look at the North in the future and discussed some of the differences that are observed between the two poles. She also showed part of this video of fan formation in the North:
Back to Earth again for the next item entitled “Only you can save planet Earth” and detailing the work of Solar Stormwatch. This project is concerned with looking at data from two cameras, one positioned slightly ahead of the earths orbit and one slightly behind which give a stereo image of the material ejected in solar mass ejections. The data from the cameras in can be combined to give an estimate of the direction and speed of the ejections and enable an early warning to be given of any activity which is headed our way. As you all probably know solar storms of this type can affect electronics, satellite communications and even the weather so any prior knowledge is of great use. The project looks at both historical data and live real time data. The historic data provides a much fuller data set than the live data but it is the patchy data in real time, which is being analysed round the clock by the people involved with the project, which can give an advanced warning of an incoming storm. Part of the presentation was a video from the cameras which shows the effect of a mass ejection on a comet, the tail is literally ripped away as the ejection front passes.
Chris Lintott was next up to talk about Planet Hunters. My notes kinda dry up here so either I was swept away by his oration or I didn’t understand a word of it – all I managed to write down was that the first exoplanet was only discovered in 1995 and the rate and number of subsequent discoveries have led to a recent estimate that there may be as many as 17 billion earth sized planets in our galaxy.
Lack of notes notwithstanding the success of the Planet Hunters project in identifying new candidates for exoplanets was clear from Chris’ presentation and particularly in finding things which have been overlooked by computers previously. Part of the current data are a set of images which are felt to contain the best bets for exoplanets – the message being if you want to find a planet now’s the time to go look.
Many of the systems found to date are somewhat strange by comparison to our home system with many systems containing 2, 3 or 4 suns, and planets of similar sizes to those in our solar system have been identified including a many which fall into the category of “Earth like”, at least so far as size goes.
The bad news is that the Kepler spacecraft which has provided much of the data for the project is now on its last legs. The good news is that another space mission is planned, there is still a huge amount of data from Kepler to be examined and other teams looking for exoplanets are keen to harness the power of the Zooniverse.
To finish the day Rob Simpson gave us a snapshot of what the future holds for the Zooniverse. He started by comparing the billions of hours spent watching TV with the 100 million hours that Wikipedia has taken to put together. The TV box filled the screen, Wikipedia just a small box by the side. By comparison Zooniverse currently attracts 2 months of effort every day, small by comparison but how much better do you all feel for it?
This image below shows the relative ‘size’ of the various Zooniverse projects over the past year. Rob has recently written a post for the Zooniverse blog about how the human effort for the last year is divided by project and how he calculated it.
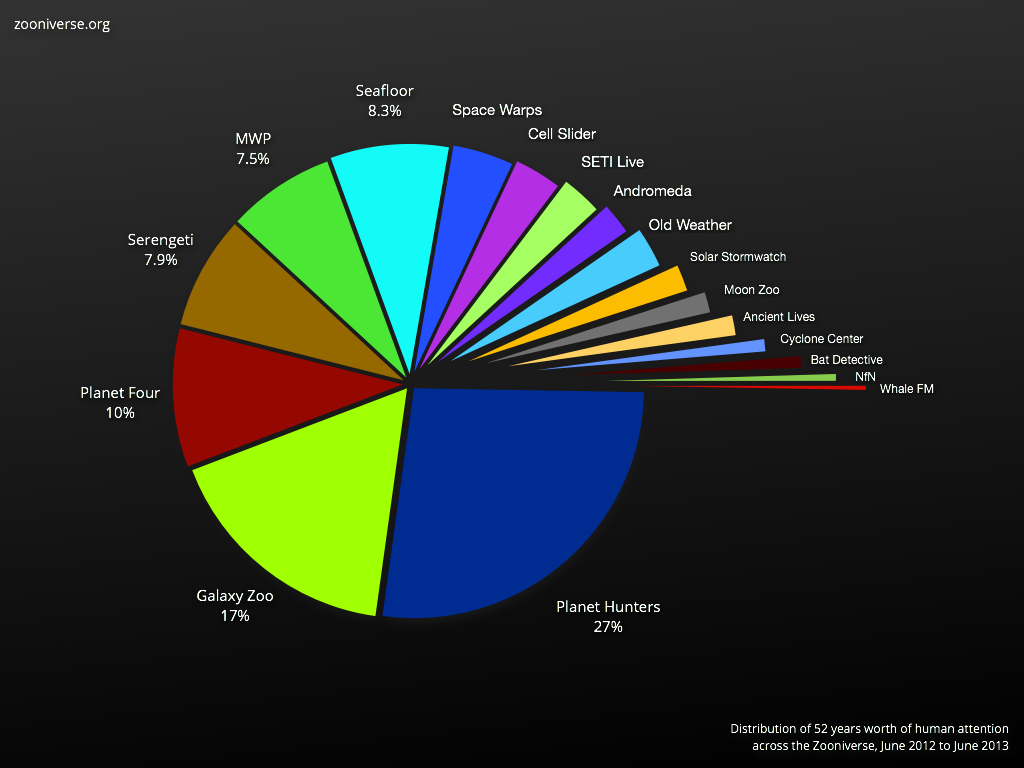
Image Credit: Rob Simpson/Zooniverse
Rob mentioned Snapshot Serengeti which provides BushCam images for you to identify the animals in view and what they are up to. This project has been very popular and from the quick visit I’ve made since returning from Oxford I can see how it could be almost as addictive as marking fans on Planet Four.
With the ‘formal’ part of ZooCon13 at an end we all retired to the nearest hostelry where, overlooked by a large oil painting of Patrick Moore, the workings of the universe were discussed long into the evening. My first ZooCon and hopefully not my last, everyone I met and talked to was friendly and keen to chat about all the workings of Zooniverse. Many have been coming to ZooCon for several years and it’s clear that many firm friendships have resulted. It was a pleasure to meet all of you and my thanks for the warm welcome to the fold you all gave me.
