
Our First Team Live Chat Today
Today we’ll be hosting a live chat with Planet Four science team starting at 7pm BST/6pm GMT/2pm EDT/11am PDT to mark the project’s 6 month anniversary. We’ll be joined by Planet Four PI Candy Hansen (PSI) and science team members K.-Michael Aye (UCLA), Ganna (Anya) Portyankina (University of Bern) and Meg Schwamb (Yale).
We’ll embed the video link here shortly before we start (if you don’t see it try refreshing your browser) and we’ll also tweet the link. You can send us your questions for the Planet Four team during the broadcast by tweeting us @Planet_Four. If you can’t make it to the watch the chat live, the recorded video will also be available here afterwards.
And don’t forget if you have questions after the live chat you can always post them to our Ask a Team Scientist thread on Talk.
Save the Date: Planet Four Live Chat
June marks Planet Four’s 6th month anniversary, and to celebrate we’re having a live chat with the Planet Four science team on June 7th (next week!) at 7pm BST/6pm GMT/2pm EDT/11am PDT .Join us here on the blog to watch the live video feed.
We’ll be joined by Planet Four PI Candy Hansen (PSI) and science team members K.-Michael Aye (UCLA), Ganna (Anya) Portyankina (University of Bern) and Meg Schwamb (Yale). We’ll be talking about the latest Planet Four news and science as well as answering some of your questions. Send us your questions for the Planet Four team, either by leaving a comment here on the blog or by tweeting us @Planet_Four
Update: You can watch the live stream and the recorded video of the chat here.
European Planetary Science Congress
Every fall the European Planetary Science Congress takes place to bring together planetary scientists from all over the world. We discuss our latest research results, new data, our new theories and ideas, and new concepts for missions.
As a group we are committed to sharing our ideas with all of the world, not just our professional colleagues. So there are always sessions on outreach and education.
This year I submitted an abstract to describe our Planet Four experience. It has been overwhelmingly positive, and I think my colleagues will be intrigued by our approach.
Candy Hansen
Planet Four Principal Investigator
Brand New Images – Year 1 Data
Today we have a post by Dr. Candice (Candy) Hansen, principal investigator (PI) of Planet Four. Dr. Hansen also serves as the Deputy Principal Investigator for HiRISE (the camera providing the images of spiders, fans, and blotches seen on the site). She is also a Co-Investigator on the Ultraviolet Imaging Spectrograph on the Cassini spacecraft in orbit around Saturn. Additionally she is a member of the science team for the Juno mission to Jupiter. Dr. Hansen is responsible for the development and operation of JunoCam, an outreach camera that will involve the public in planning images of Jupiter.
Wow – I just checked Planet Four and found that we had passed 70,000 participants; 70,334 to be exact, as of today. Thank you all for your many hours of hard work (and fun!).
To keep our most dedicated folks going we’ve added the first year of Mars Reconnaissance Orbiter operation (Year 1) to the image collection, although we are not quite finished with Year 2 and Year 3. We started with Year 2 and Year 3 mainly because we were much better at picking good locations and configuring the camera properly. Year 1 is a little more challenging, but interestingly the spring was also rather different from that of the subsequent years. Just like on Earth in some years we have more severe winter storms than others.
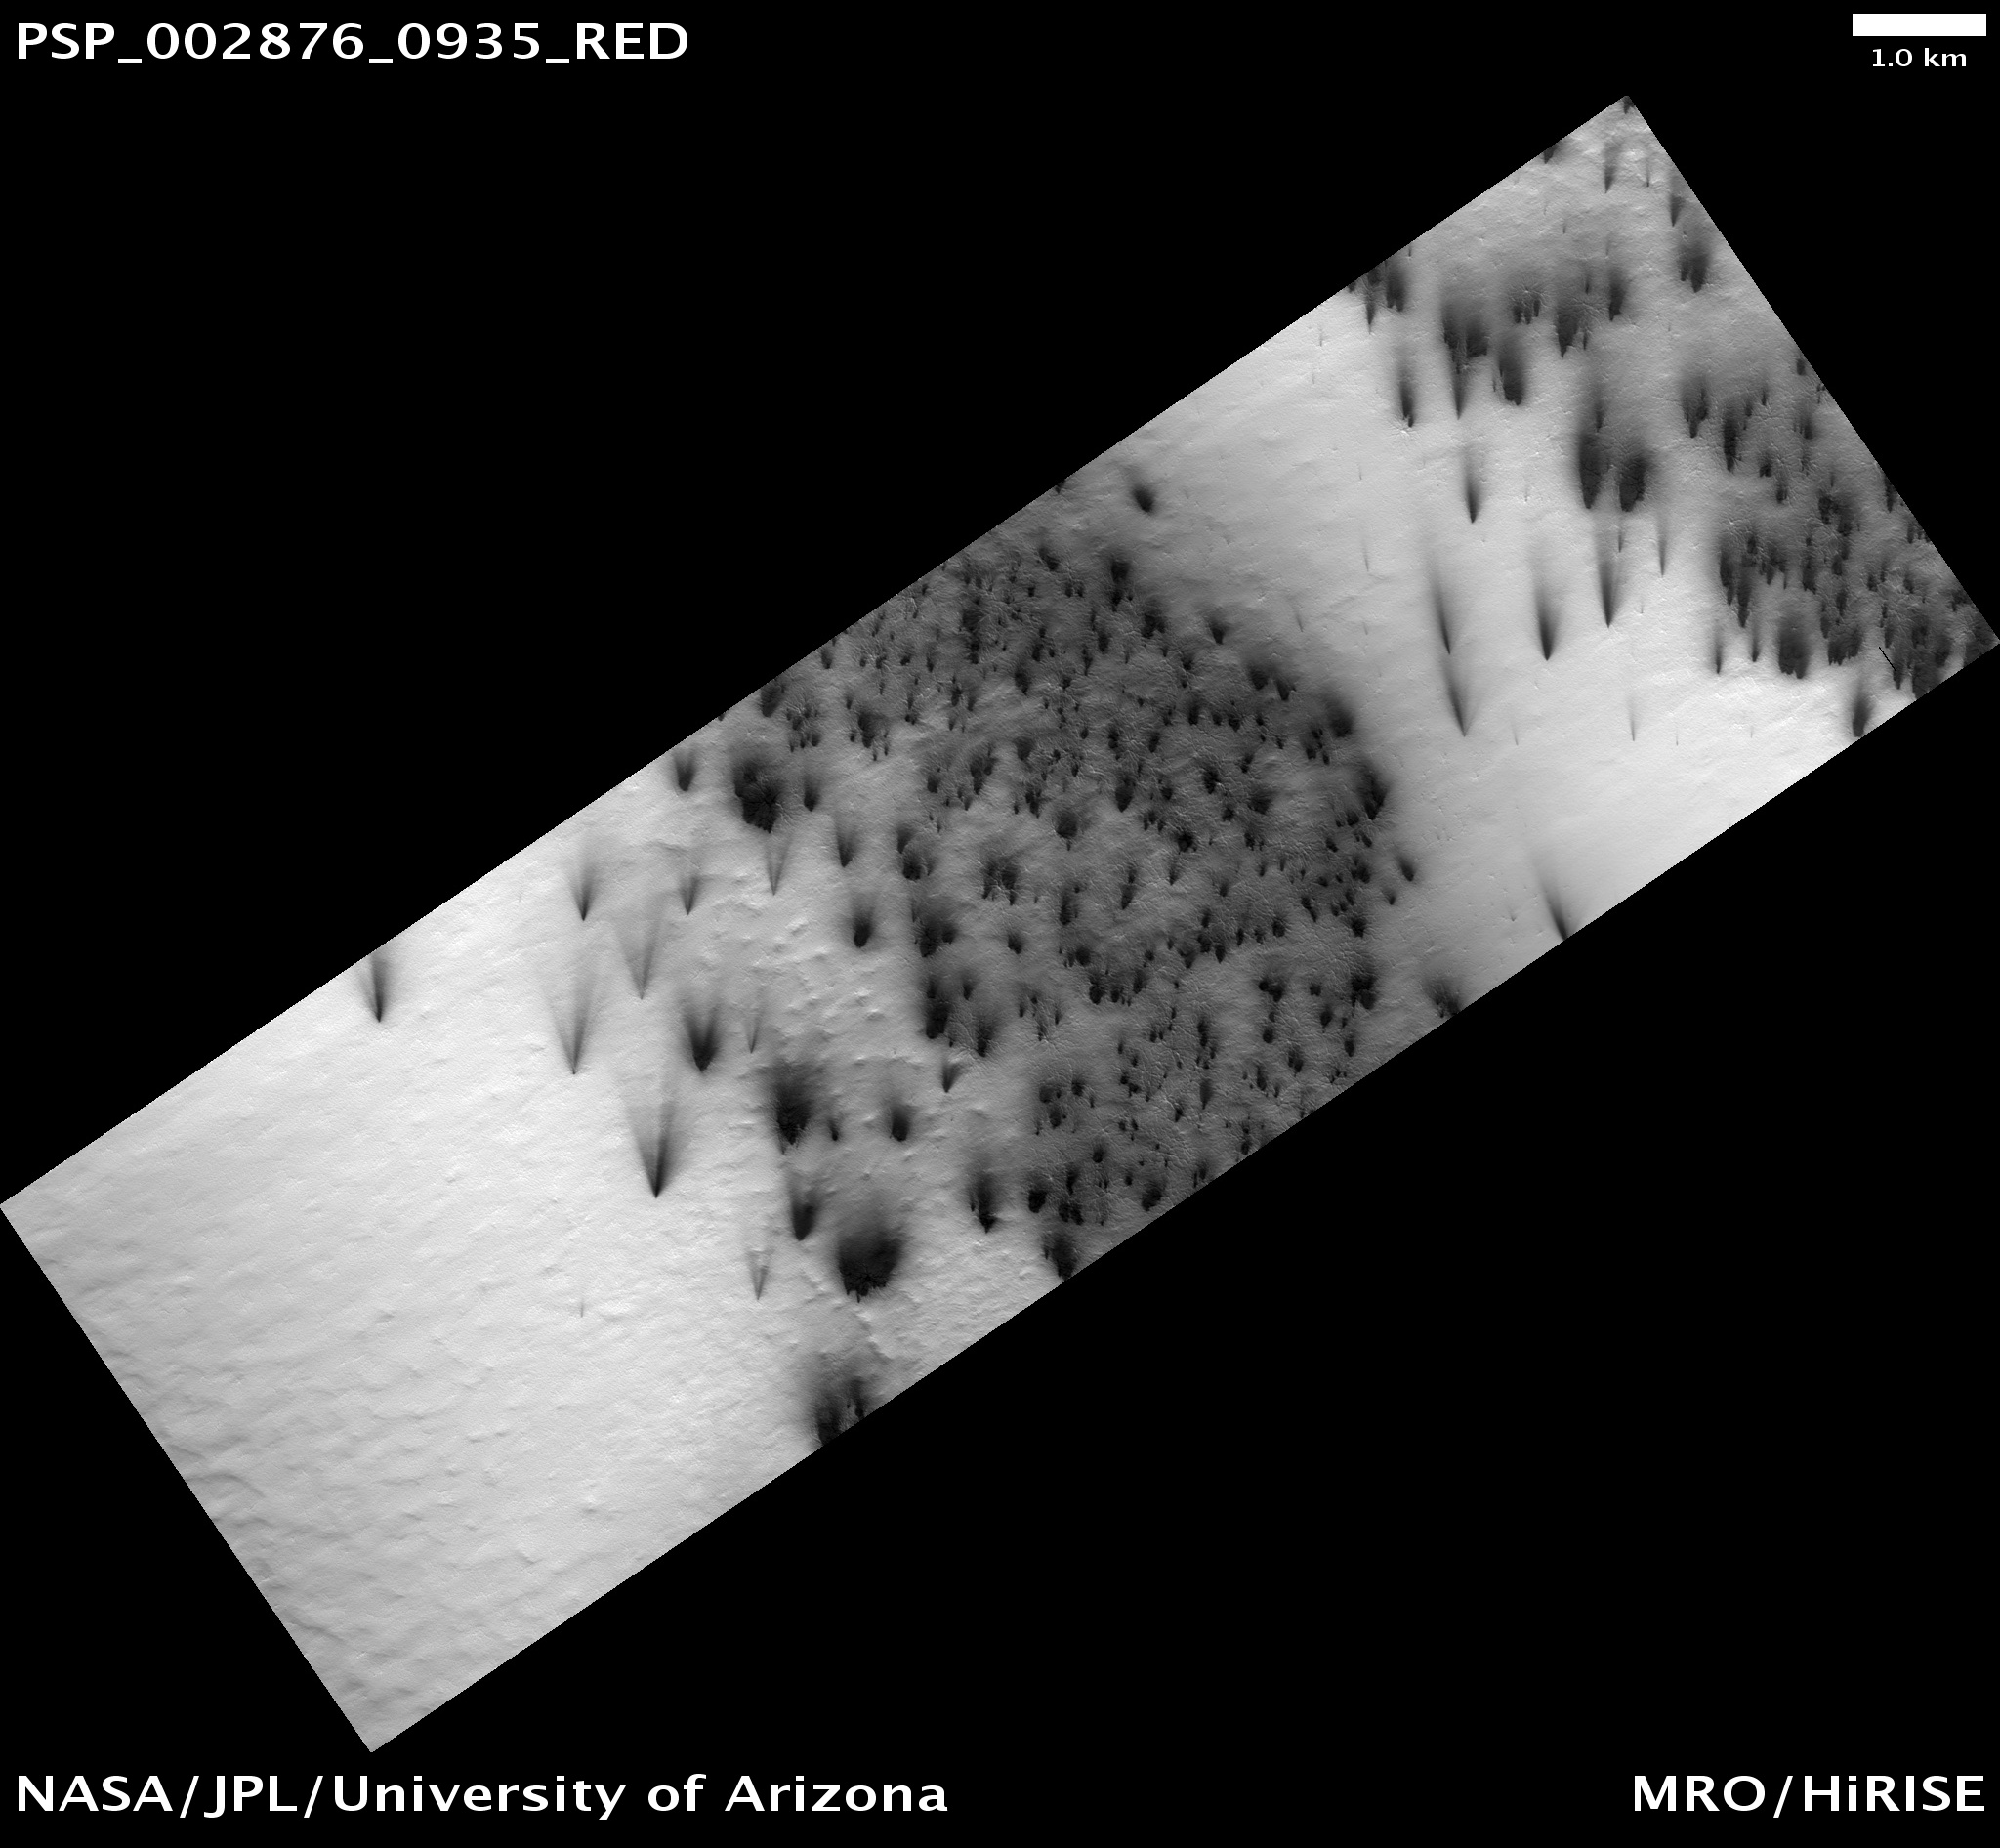
Region dubbed Manhattan thawing in Year 1 – You can find more about the observation at http://hirise.lpl.arizona.edu/PSP_002876_0935
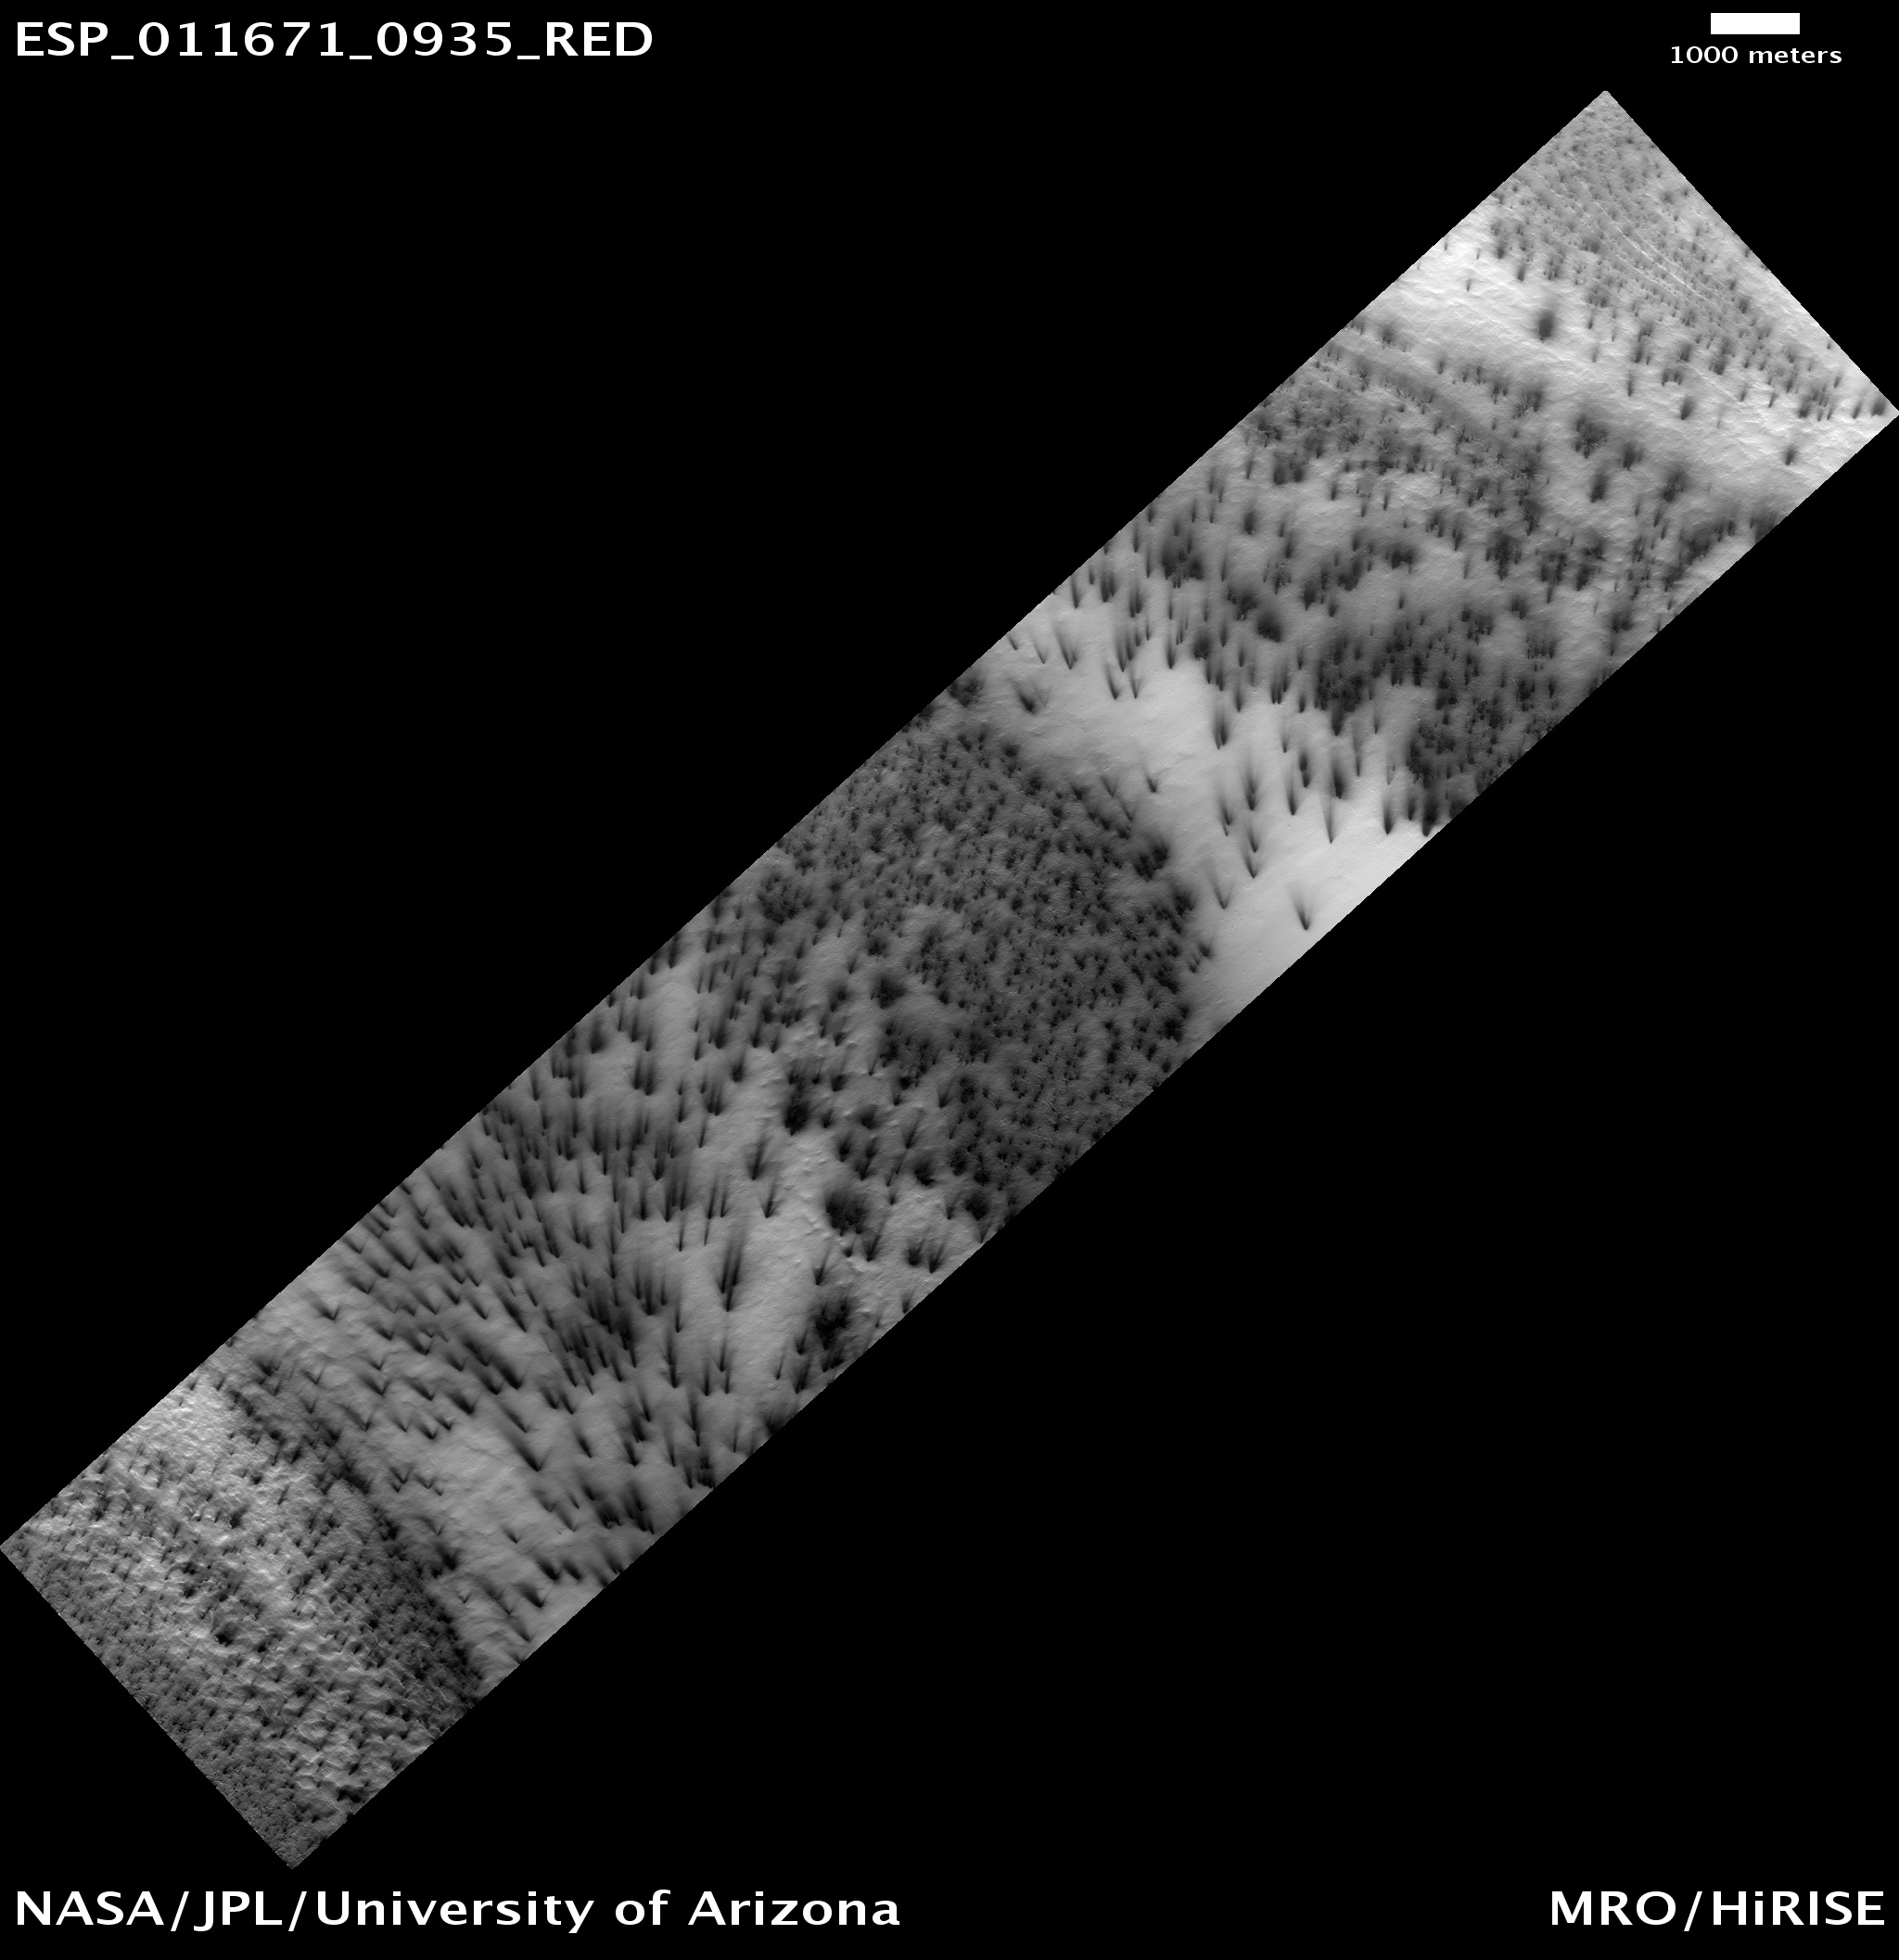
Manhattan defrosting in Year 2. Many more fans than appear in Year 1. You can find more about the observation at http://hirise.lpl.arizona.edu/ESP_012739_0935
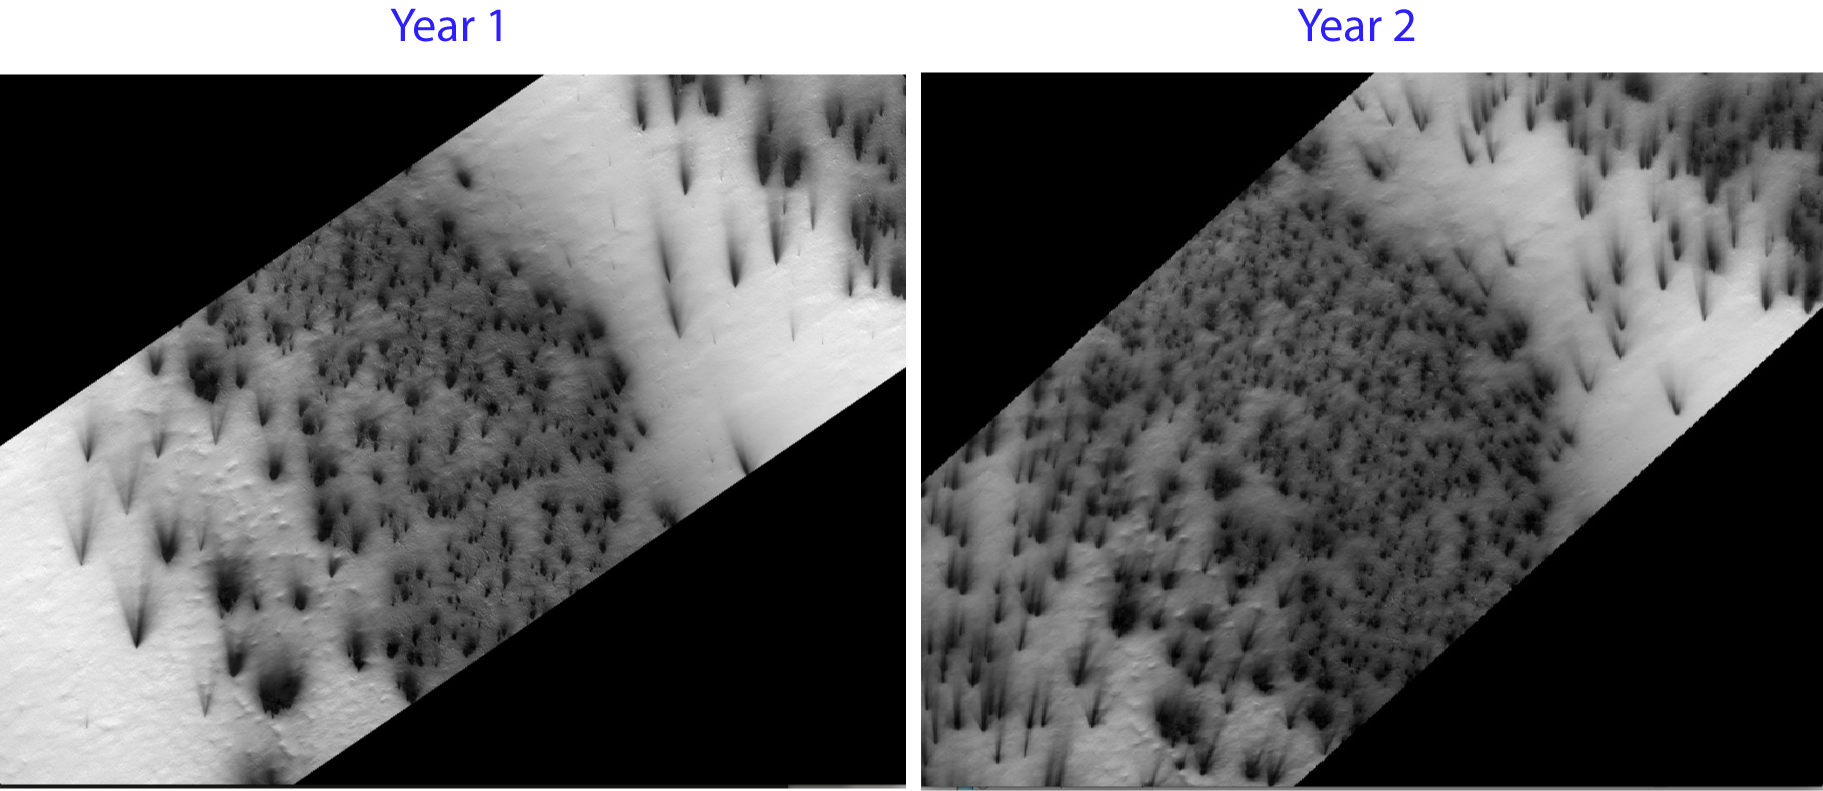
Same region aligned roughly in Manhattan to compare defrosting in Year 1 to Year 2.
In this case it appears that there was more frost and ice in Year 1 than Year 2 or 3, but it could also be that it just warmed up earlier in the latter years. So give it your best effort because I think the results will be fascinating.
In the meantime we are busy with our part of the task – digesting all of your measurements and figuring out what they are telling us about Mars. Sometimes I feel like we aren’t holding up our end of the bargain, but then again there are just four of us, and over 70,000 of you!
As you can see from Meg’s post, NASA HQ has taken notice of this effort. I reported on the Planet Four experience at our last HiRISE team meeting and a number of my colleagues were excited about other potential citizen science projects. Go Zooniverse!
Help us understand how Year 1’s weather and climate differs from Year 2 and Year 3 by mapping the fans and blotches on the new never-before-seen images on Planet Four today.
Planet Four at the Planetary Science Subcommittee Meeting
The Planetary Science Subcommittee NASA Advisory Council met at NASA Headquarters earlier this month and was given a status update on all of the research areas in planetary science related to NASA missions. The meeting and the role of the subcommittee is to gather input and report information from the scientific community and public relevant to current and future NASA missions and programs.
At the meeting Lisa May, Lead Program Executive for the Mars Exploration Program, presented on the status of the current and future Mars missions. In her presentation she talked about Planet Four and the work that you’ve all been doing marking the fans and blotches in the HiRES images or as she put it “tens of thousands citizens of planet Earth classify images of spring on Mars” Below is the slide from her talk.
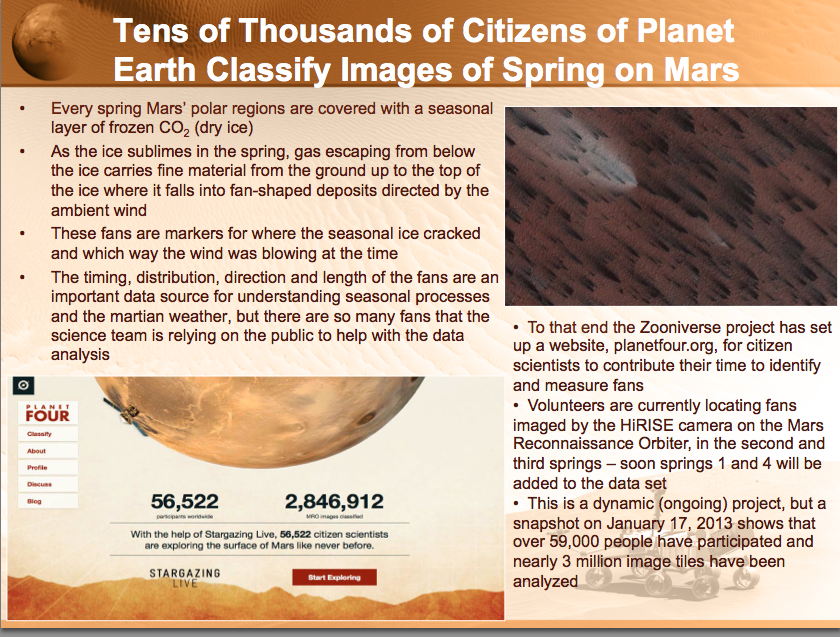
Image credit: NASA Mars Exploration Program – Lisa May, Michael Meyer,Jim Green, Director
You can read through the entire Mars Exploration Program presentation here.
Standing on the Surface
With the HiRISE images we show on Planet Four, you’re peering down at the Martian surface from above, seeing the fans and blotches that we want you to you mark. What would something like the image below look like from the ground if you were standing on the thawing carbon dioxide ice sheet during the Southern spring?
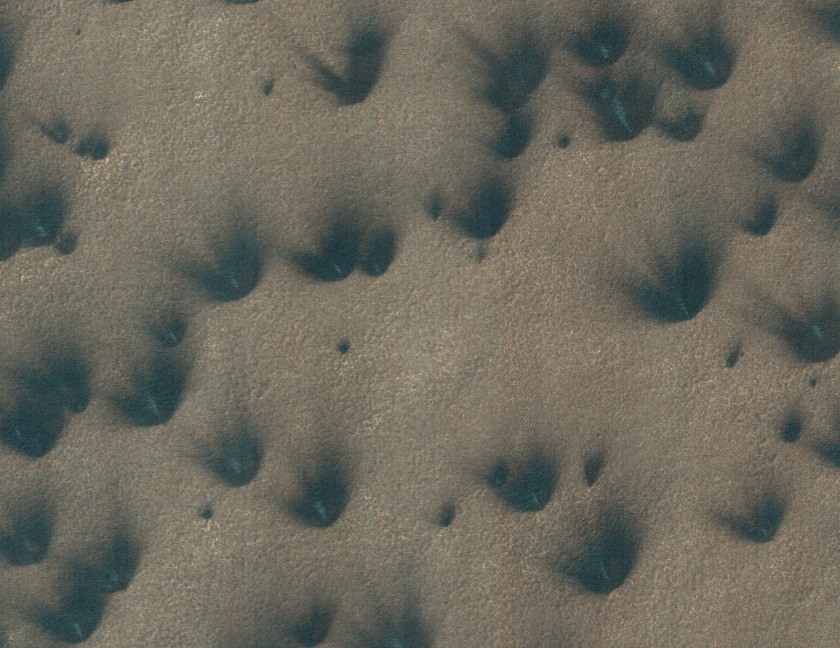
Well, if the geysers were actively lofting carbon dioxide gas and dust and dirt from below the ice cap up onto the surface and into the Martian air, you’d probably see something like the artist’s conception below.
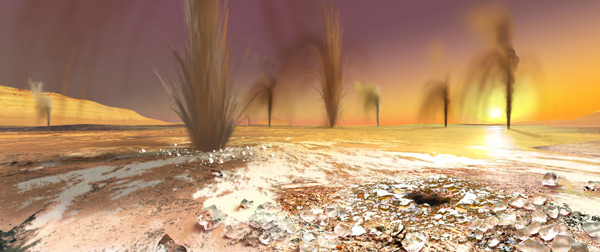
Artist’s rendition of geysers on the South Pole of Mars – Image credit; Arizona State University/Ron Miller
How high are the plumes? Current estimates suggest that the geysers and material it lofts stay relatively close to the ground going probably no higher than about 50-100m into the air according to previous estimates based on fan length and simple deposition models. Though more likely, the geysers achieve smaller heights than that most of the time. To try and directly measure the geyser plume heights, stereo imaging where Mars Reconnaissance Orbiter pointed at the same spot twice at different look angles has been used. The two resulting HiRISE images are then combined to give height information in much the same way our brains combine the images obtained from our eyes, each viewing at a slightly different angle and position than the other, to get depth perception. HiRISE would have been able to see the geyser plumes above the ground in the combined stereo pairs, if the majority achieved heights of 50-100 m, but no image to date yet has caught a detection of a plume. So that suggests that the geysers may not reach these maximum heights but instead only go up to maybe 5-10m off the ground.
Your clicks may be able to help constrain better the height of the geyser plumes. With your classifications, we will have the largest sample of fan lengths and directions and blotch radii ever measured on the Martian South Pole. With the fan lengths from your markings, a measure of the terrain’s slope, and an assumption for the particle size of the Martian dirt/dust being entrained by the escaping carbon dioxide gas, you can estimate the maximum height needed to loft the material for it to fall at a given distance from the geyser for a range of wind speeds.
“space chimney” re-imaged
Dear citizen scientists!
About 2 months ago here and here you have discussed this weirdly looking structure:
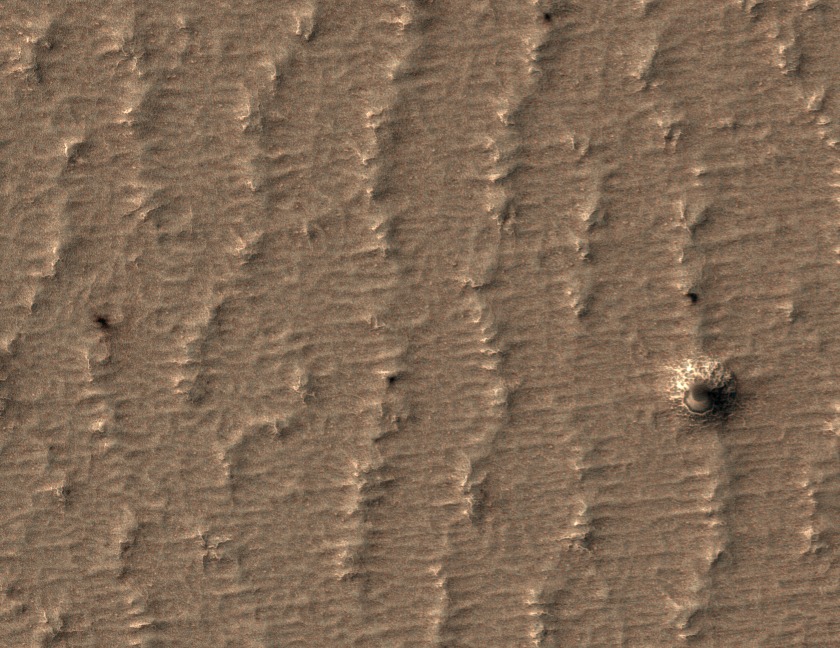
Back then I promised to get HiRISE to image this scene again when the ice is gone. The image is now here, very fresh from the production pipeline:
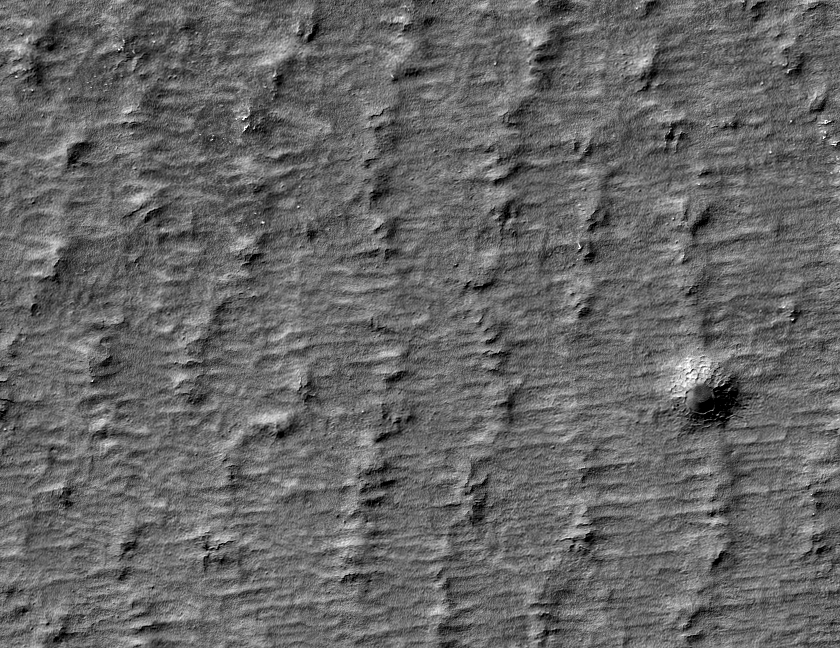
I framed this image exactly the same as the original “topic-starter”. This way everybody can see that we are talking about the same feature, as 2 months ago. The ice cover is not completely gone yet: one can still see small persistent leftovers in some shadowed places, mostly in small channels. But ice has cleared the feature in question. It happened to be a crater with an unusual inner surface. As often it is hard to see if it is a cone or a depression, but we know that the sunlight comes from bottom right-ish and this tells us it is a crater. To see it better, here is the best zoom HiRISE has to offer (appr. 30 cm/pix resolution):
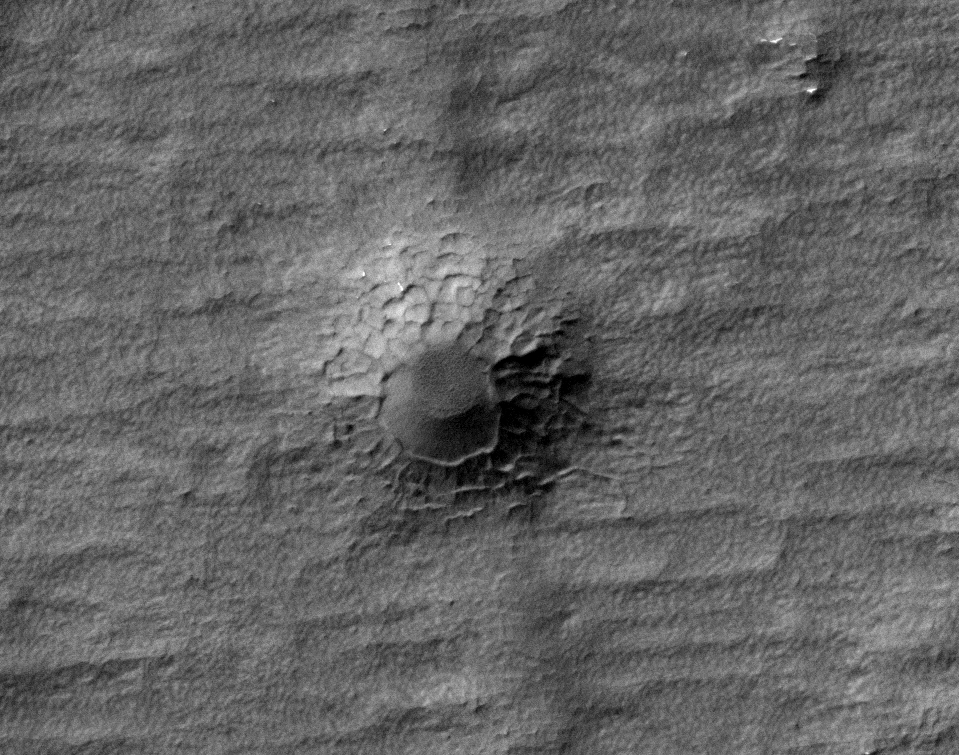
Without the ice the crater floor looks smooth and its sides show very pronounced polygons. The ice in the trenches between these polygons created the illusion of a bright branching “crown” in our original image. And smooth blanketing on one side of the crater had smooth ice cover that tricked people into seeing Dalek or octagonal-based chimney. So sorry that neither of those are real!
When I saw the polygons inside the crater, I decided to ask my more knowledgeable colleague about them. Mike Mellon (from Southwest Research Institute in Boulder, CO) did a lot of research about polygons on Mars and Earth. He had a look at both, old and new, HiRISE images for us:
“I can see that there are loads of eroded polygons in the region. There are large ones with clear evidence of subdivision into smaller forms. Smaller polygons cover nearly all the surface (roughly 3 meters in diameter). In some areas they are clear and in others they are so small and flat they are a little hard to see. They are completely invisible at the old image because of its poor resolution. The polygons inside the crater are on the order of 5 meters with more deeply incised troughs, so they are easier to see. The crater floor looks featureless. I see these same larger polygons in the neighboring pits, the pits that appear arrayed N-S. The larger polygon size in the crater may be caused by sun light on the crater slopes.
The presence of polygons and their sizes are consistent with ice cemented soils about 2-5 meters deep. But it is not easy to interpret the details and especially hard to eliminate the seasonal effects from this discussion, as this location is very close to the polar cap and spider-related processes happens here and there.”
With this we came back to where we have started from: fans and spiders. The image made it to this project because it had them all. Now plus polygons, minus the chimney.
A Message from the PI
Today we have a post by Dr. Candice (Candy) Hansen, principal investigator (PI) of Planet Four. Dr. Hansen also serves as the Deputy Principal Investigator for HiRISE (the camera providing the images of spiders, fans, and blotches seen on the site). She is also a Co-Investigator on the Ultraviolet Imaging Spectrograph on the Cassini spacecraft in orbit around Saturn. Additionally she is a member of the science team for the Juno mission to Jupiter. Dr. Hansen is responsible for the development and operation of JunoCam, an outreach camera that will involve the public in planning images of Jupiter.
Dear Citizen Science Colleagues,
I have been lurking on the chat pages and reading your comments and thoroughly enjoying this whole experience. It is hard to believe that just last December Arfon and I were still drawing diagrams on napkins. Now we have a Zooniverse project underway!
Anya and Michael and I have been discussing this project for several years; Meg and I actually discussed this concept when she was still a graduate student. We were always daunted by the sheer amount of image processing we would have to do.
So now with all of your help we will be able to move forward. The spring season on Mars is a very non-terrestrial experience, as you have seen as you’ve looked at the images. The channels we see carved in the surface are there because the dry ice seasonal polar cap goes directly from solid to gas, and that pressurized gas erodes the surface. The eroded surface material is carried up out onto the surface of the seasonal ice and is deposited in the fans that you have been identifying and measuring.
We want to learn more about this unearthly process, so with your help we will now be able to calculate our first result – the number of fans that erupt as the spring goes by. The overall number of fans as time passes records the level of activity as the overlying ice thickness and level of sunlight changes.
Our objectives that are associated with understanding the weather in the spring will take longer to tease out. We will keep you posted as we make progress.
When an image cutout has been reviewed by 100 people it is retired. At this point you have completed the analysis of 34% of the 42,903 image cutouts. 75% of the cutouts have been reviewed by more than 50 people.
You have been analyzing images from the second and third spring seasons observed by the Mars Reconnaissance Orbiter. We will have images from the first spring ready to go soon, and those from year 4 in another month or two.
We have ideas for other projects – we hope you will continue to enjoy working with us. Your effort and enthusiasm are really an inspiration to us!
Sincerely,
Dr. Candice Hansen
Let’s talk about color
Here at PlanetFour we are really happy to share with you color images taken with the HiRISE camera. But we should have written one disclaimer somewhere a long time ago:
HiRISE is a great camera, but it, unfortunately, does not show you the martian surface in the colors that you would see with your own naked eyes.
If you would find yourself on Mars (lucky you!) things would look different. Sorry for this, but actually, no camera, even here on Earth, does show you exactly the same as what you see. You might be familiar with the situation when two different cameras take two images in the same setting and one image turns out reddish while the other one – totally greenish. Why is that? The answer lies in the way cameras, or more strictly saying camera detectors, create color images.
Let’s start from creating a black and white image. This is fairly simple: each pixel of our CCD is sensitive to light, i.e. the more light it gets the higher digital number it records. When you arrange many of pixels next to each other and place them all in front of a contrast scene, dark areas will get small numbers, bright areas – large numbers, and you have created a digital image of the scene. This image contains only intensity information and no color information. In real life most standard CCD cameras are sensitive in the wide visible range with enhancement in the red side of the spectrum.
By the way, our eyes have something like a CCD: the retina, an array of cells sensitive to light. For example, an array of rod cells would most closely resemble a black and white CCD. Rods are very sensitive and allow us to see in rather dim light, but only in shades of gray. Additionally, we have a set of cone cells of three different types. These are not as sensitive as rod cells and highly specialized: each type is sensitive to different parts of the visual spectra, Red, Green and Blue. Combination of the signals from these gives us color vision.
As one can see on the plot below, the standard CCD’s spectrum coverage is larger compared to the human eye and it is more sensitive in the red side of the spectrum. Human vision coverage is shown here separately for scotopic vision (means vision with rod cells, i.e. in low light conditions) and photopic (with cone cells, i.e. color vision.)
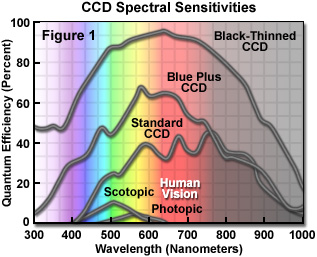
The figure is from http://www.microscopyu.com
To create a color image HiRISE combines images from three CCDs each of which has a color filter placed in front of it. For a realistic color image we would ideally want to combine Red, Green and Blue images. Or any other set of colors that, when mixed, can reproduce the full color spectrum available to the human eye.
In reality HiRISE has Red, Infra-Red and Greenish-Blue filters. The scientific team of the camera selected this set of colors to be able to distinguish different minerals in the top surface of Mars from each other but also for some technical reasons. It is hard (and expensive) to make a CCD sensitive in the blue side of the spectrum. It is also hard to produce filters that let only very narrow spectral band to pass through. This is why the HiRISE Blue filter is slightly greenish.
If one simply merges the available HiRISE filters together, the result is similar to the left side of the image below. Here the Red channel carries the IR image from HiRISE, the Green channel the Red HiRISE image, and the Blue channel the Green-Blue HiRISE image. And they all are scaled in such a way, that their maximum and minimums are the same (what we call “normalized”). One can see in a small diagram in the top left corner the histograms for the three channels, each drawn in the color they represent. And where they overlap, the color tells you the resulting color of the mix. Because green and blue channels are so similar (HiRISE IR and Red filters are overlapping), our image is mostly yellow-green.
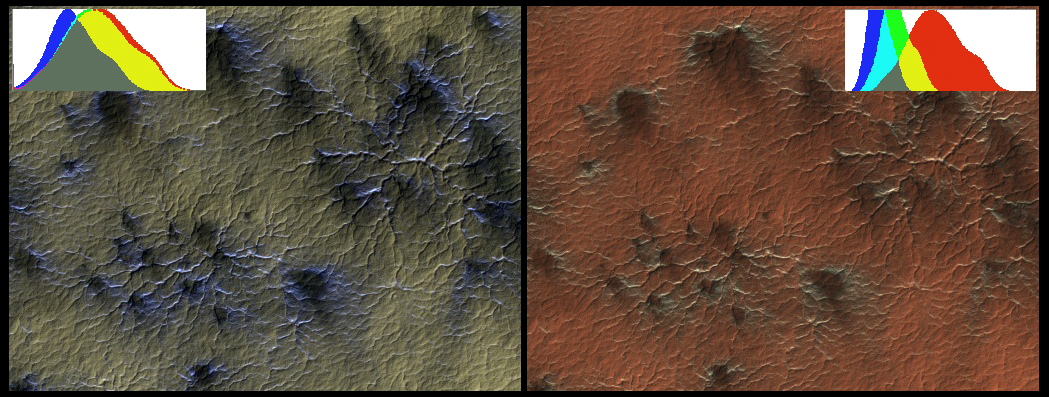
On the right side you see more realistic RGB image created by the HiRISE team to give us better color impression. Smart computer code written by HiRISE engineers artificially created a synthetic green channel from the information available in the three real HiRISE channels. It also slightly increased the “weight” of blue and green channels while putting the three new channels together. In this image it helps to highlight the bluish fans. In other cases it might be useful to increase only blue (or maybe red?) to highlight other features, like minerals in the ground. We can see the effect of these changes in the histogram in the top right corner – red channel stayed mostly same, while blue and green are now narrow and tall, actually off the charts on this plot.
The conclusion? The color information in the images you see in this project is real. The way this information is put together to create a color image varies from image to image. This makes it harder to compare colors between different images, but easier to see features inside each image. There is always a tradeoff, always. For now, let’s admire our pretty color images one at a time. With a pinch of colourful salt.
by Anya Portyankina and Klaus-Michael Aye
Martian Timekeeping
A year on Earth is 365.25 days, but it takes Mars nearly twice as long to complete one revolution around the Sun. With 668.6 sols (a sol is a Martian day), how do scientists keep track of the Martian time and date?
A Martian sol happens to be 39 minutes and 35 seconds longer than Earth’s. Dating back to the days of the Viking landers, sols are kept on a 24 hour clock. With the extra 40 minutes, Martian hours, minutes and seconds are slightly longer than their Earthly counterparts. That can make it a bit difficult to have a Mars time wrist watch.
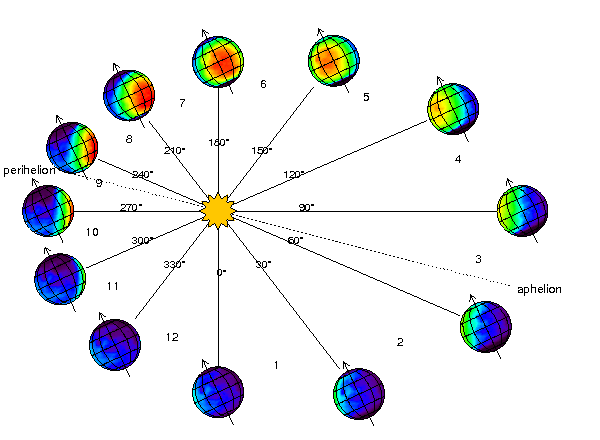
The Martian calendar is not broken up into months like we have on Earth. Instead planetary scientists use the position of Mars in its orbit to tell time and mark seasons. They use the solar longitude L_s (pronounced “L sub S”) which is the Mars-Sun angle to keep track of the year. L_s=0 degrees is when Mars is at the northern vernal (Spring) equinox. L_s=90 degrees when at the Northern Summer Solstice) 180 degrees at the Northern Autumnal Equinox and 270 degrees at the Northern Winter Solstice. Just think the opposite to get the specific season for Mars’s Southern Hemisphere.
This upcoming February 23rd will mark the Winter solstice in the Northern hemisphere (Summer solstice in the Southern hemisphere). So on the South Pole there should be some seasonal fans, like the ones you’re mapping on the main classification interface, currently visible to HiRES where there is still thawing carbon dioxide ice.
You can find out more about the Martian Calendar and the dates of future solstices with this post by the Planetary Society.
