
NASA funding for utilizing Planet Four markings

It is really-really tough to get funding to do research. You have to have an idea to do something really new and important, something that will be interesting and useful. You need to gather a team that can do it. Then you have to write a proposal to explain your idea and to convince other scientists that this project is worth pursuing. And you’ll be competing with other projects for the limited budget pot. It was even tougher than usual this year for planetary research at NASA: only 14% of all submitted projects got funding.
But we did!
A little project that utilizes the data from Planet Four will be funded by NASA so that we can compare directions of winds mapped by our citizen scientists (via fans, of course!) to the prediction of martian climate models!
This is so very exciting!
We have a great team here and I am convinced this project will be a great success! Thanks NASA and thanks all of our helpers on planet4!
Anya
Making the Final Push for the First Paper
After two years, thanks to your time and effort we’re the closest ever to submitting the first Planet Four science paper based on Season 2 and Season 3 HiIRSE observations. To make the final push to get the paper submitted in the next several months to a scientific journal, the science team has switched to having telecons every two weeks. As of today, we’ve got more than half the paper draft written. Michael is working on creating the catalog of fans and blotches by combining the multiple classifier markings for each cutout. I’m in the middle of analyzing the gold standard data where the science team classified a small subset of the tiles to compare to the fan and blotch catalog in order to assess the accuracy and recall rate of Planet Four at identifying fans and blotches. Chuhong has completed the pipeline to get the map projection and spacecraft information we need. Everyone, including Anya and Candy, has been working on the paper text.
Thank you for helping us get this far. We couldn’t do this without you, and we still need your help. After doing some checks on the tiles, we realized that a subset of the Season 2 and Season 3 tiles still need classifications to get them over our 30 classification completion limit. We’ve put these images back into rotation on the site, and paused most of the recent Inca City data until these tiles are completed. The faster we get the classifications for the remaining Season 2 and Season 3 images, the faster we can get to producing the final catalog for the first paper and start showing the latest Inca City images again.
If you have some time to spare, let’s make the final push for the first paper. Help map the final set of Season 2 and Season 3 HiRISE observations today at http://www.planetfour.org . Thanks for being a part of Planet Four, and thank you for your help.
Spring 5 in Inca City
The HiRISE camera right has been taking observations looking for activity on the Martian South Pole over the past few months as part of the new monitoring season (Season 5). In August, we partnered with the HiRISE team for a public vote to determine which polar region would have its first observation prepared for public release. The region dubbed ‘Inca City’ won. We have a big surprise. Not just one image, but all currently available observations this season of Inca City were publicly released by the HiRISE team. That’s right 5 brand new images of Inca City were recently released! You can find these images at:
- Spring in Inca City I
- Spring in Inca City II
- Spring in Inca City III
- Spring in Inca City IV
- Spring in Inca City V
(If you’re looking to make your computer more Planet Four-themed, each of the links above have versions of the images formatted to be computer desktop backgrounds.)
Today, we have a post by Planet Four Principal Investigator Candy Hansen telling tell you more about these observations:
It is southern spring again, and once again we are taking images of our favorite locations. We return to the same sites so that we can study processes from year-to-year. Do spring processes always play out similarly? Or do the occasional dust storms affect when fans appear and the pace of seasonal activities?
This location is known informally as Inca City. As citizens of Planet Four you already know that a seasonal polar cap composed of CO2 ice (dry ice) forms every winter. In the spring the ice sublimates from the top and the bottom of this layer of ice, and under the ice the trapped gas builds up pressure. Eventually a weak spot in the ice ruptures, and the gas escapes, carrying material from the surface with it. The material is deposited on the top surface of the ice, forming the fans and blotches that you have been measuring.

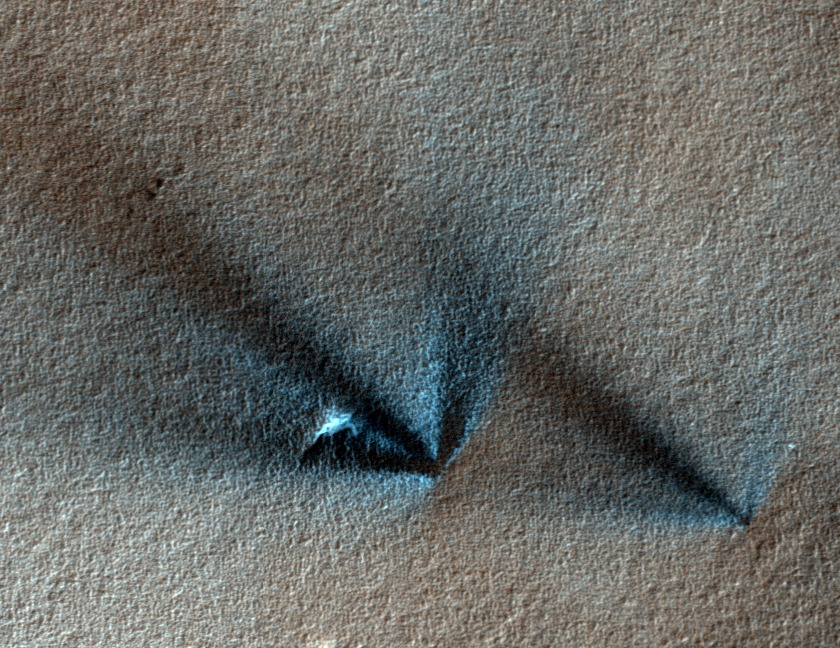
Inca City has distinctive ridges, one of which is shown at the top of this series of cutouts. The first cutout on the left was the first image to be taken after the sun rose, marking the end to polar night. We label time on Mars by “Ls”, which indicates the position of Mars in its orbit. Spring officially starts on Ls = 180, so at Ls = 174 there is very little sunlight. In spite of the small amount of sunlight seasonal activity has already started, and fans can be seen emerging from “spiders”, known formally as “araneiforms”.
These images have not been map-projected yet, so use the black arrow pointing at one of the spiders to orient the same locations from image to image. In the second image from the left, taken about 2 weeks later, you can see that the fan from that spider has become more prominent. In the araneiforms above so much dust has blown out that the individual fans seen in the leftmost image have begun to merge. The ridge is peppered with small spots where the seasonal ice has ruptured (blue arrow). Near the bottom of the second image there are new fans associated with boulders. Below that, at the bottom of the image, four new rupture sites have fans going in multiple directions.
The differences between the second and third images from the left are not substantial. That is because the time difference between the two is just 6 days, or “sols”. Fans on the ridge have lengthened just a bit, possibly due to fine material sliding downslope. In the fourth image from the left, taken at Ls = 191, the fans covering the araneiforms and on the ridge slope appear grey – are fine particles sinking into the ice? At the bottom of the image distinctive bright bluish fans are apparent.
Look at the boxed area in the 5th image and compare it to that same area in the 4th image, just below the indicated spider. The bland surface in the 4th image is now cracked. Polygonal cracks typically occur at this time in the spring. There are no easily-ruptured weak spots, so the pressure of the gas below the ice simply cracks the large plate of ice. The ice must have thinned to the point at which this pressure can break the ice sheet. Once it has cracked the gas escapes and new fans emerge, aligned along the cracks.
The ice has continued to thin by the time of the 6th image, and the araneiforms have likely defrosted entirely. More small fans emerge from cracks in the ice.
A Summary of a P4 Summer

At the end of August, Chuhong Mai presented a summary and results from her undergrad summer research internship at the Institute of Astronomy Astrophysics, Academia Sinica working with Meg on Planet Four. You can learn more about Chuhong here.
Chuhong spent July and August in Taiwan working on map projecting HiRISE images and exploring frost features. She kindly agreed to share her final presentation talk slides (see below) and some text to describe each slide. Thanks Chuhong for all your help this Summer!
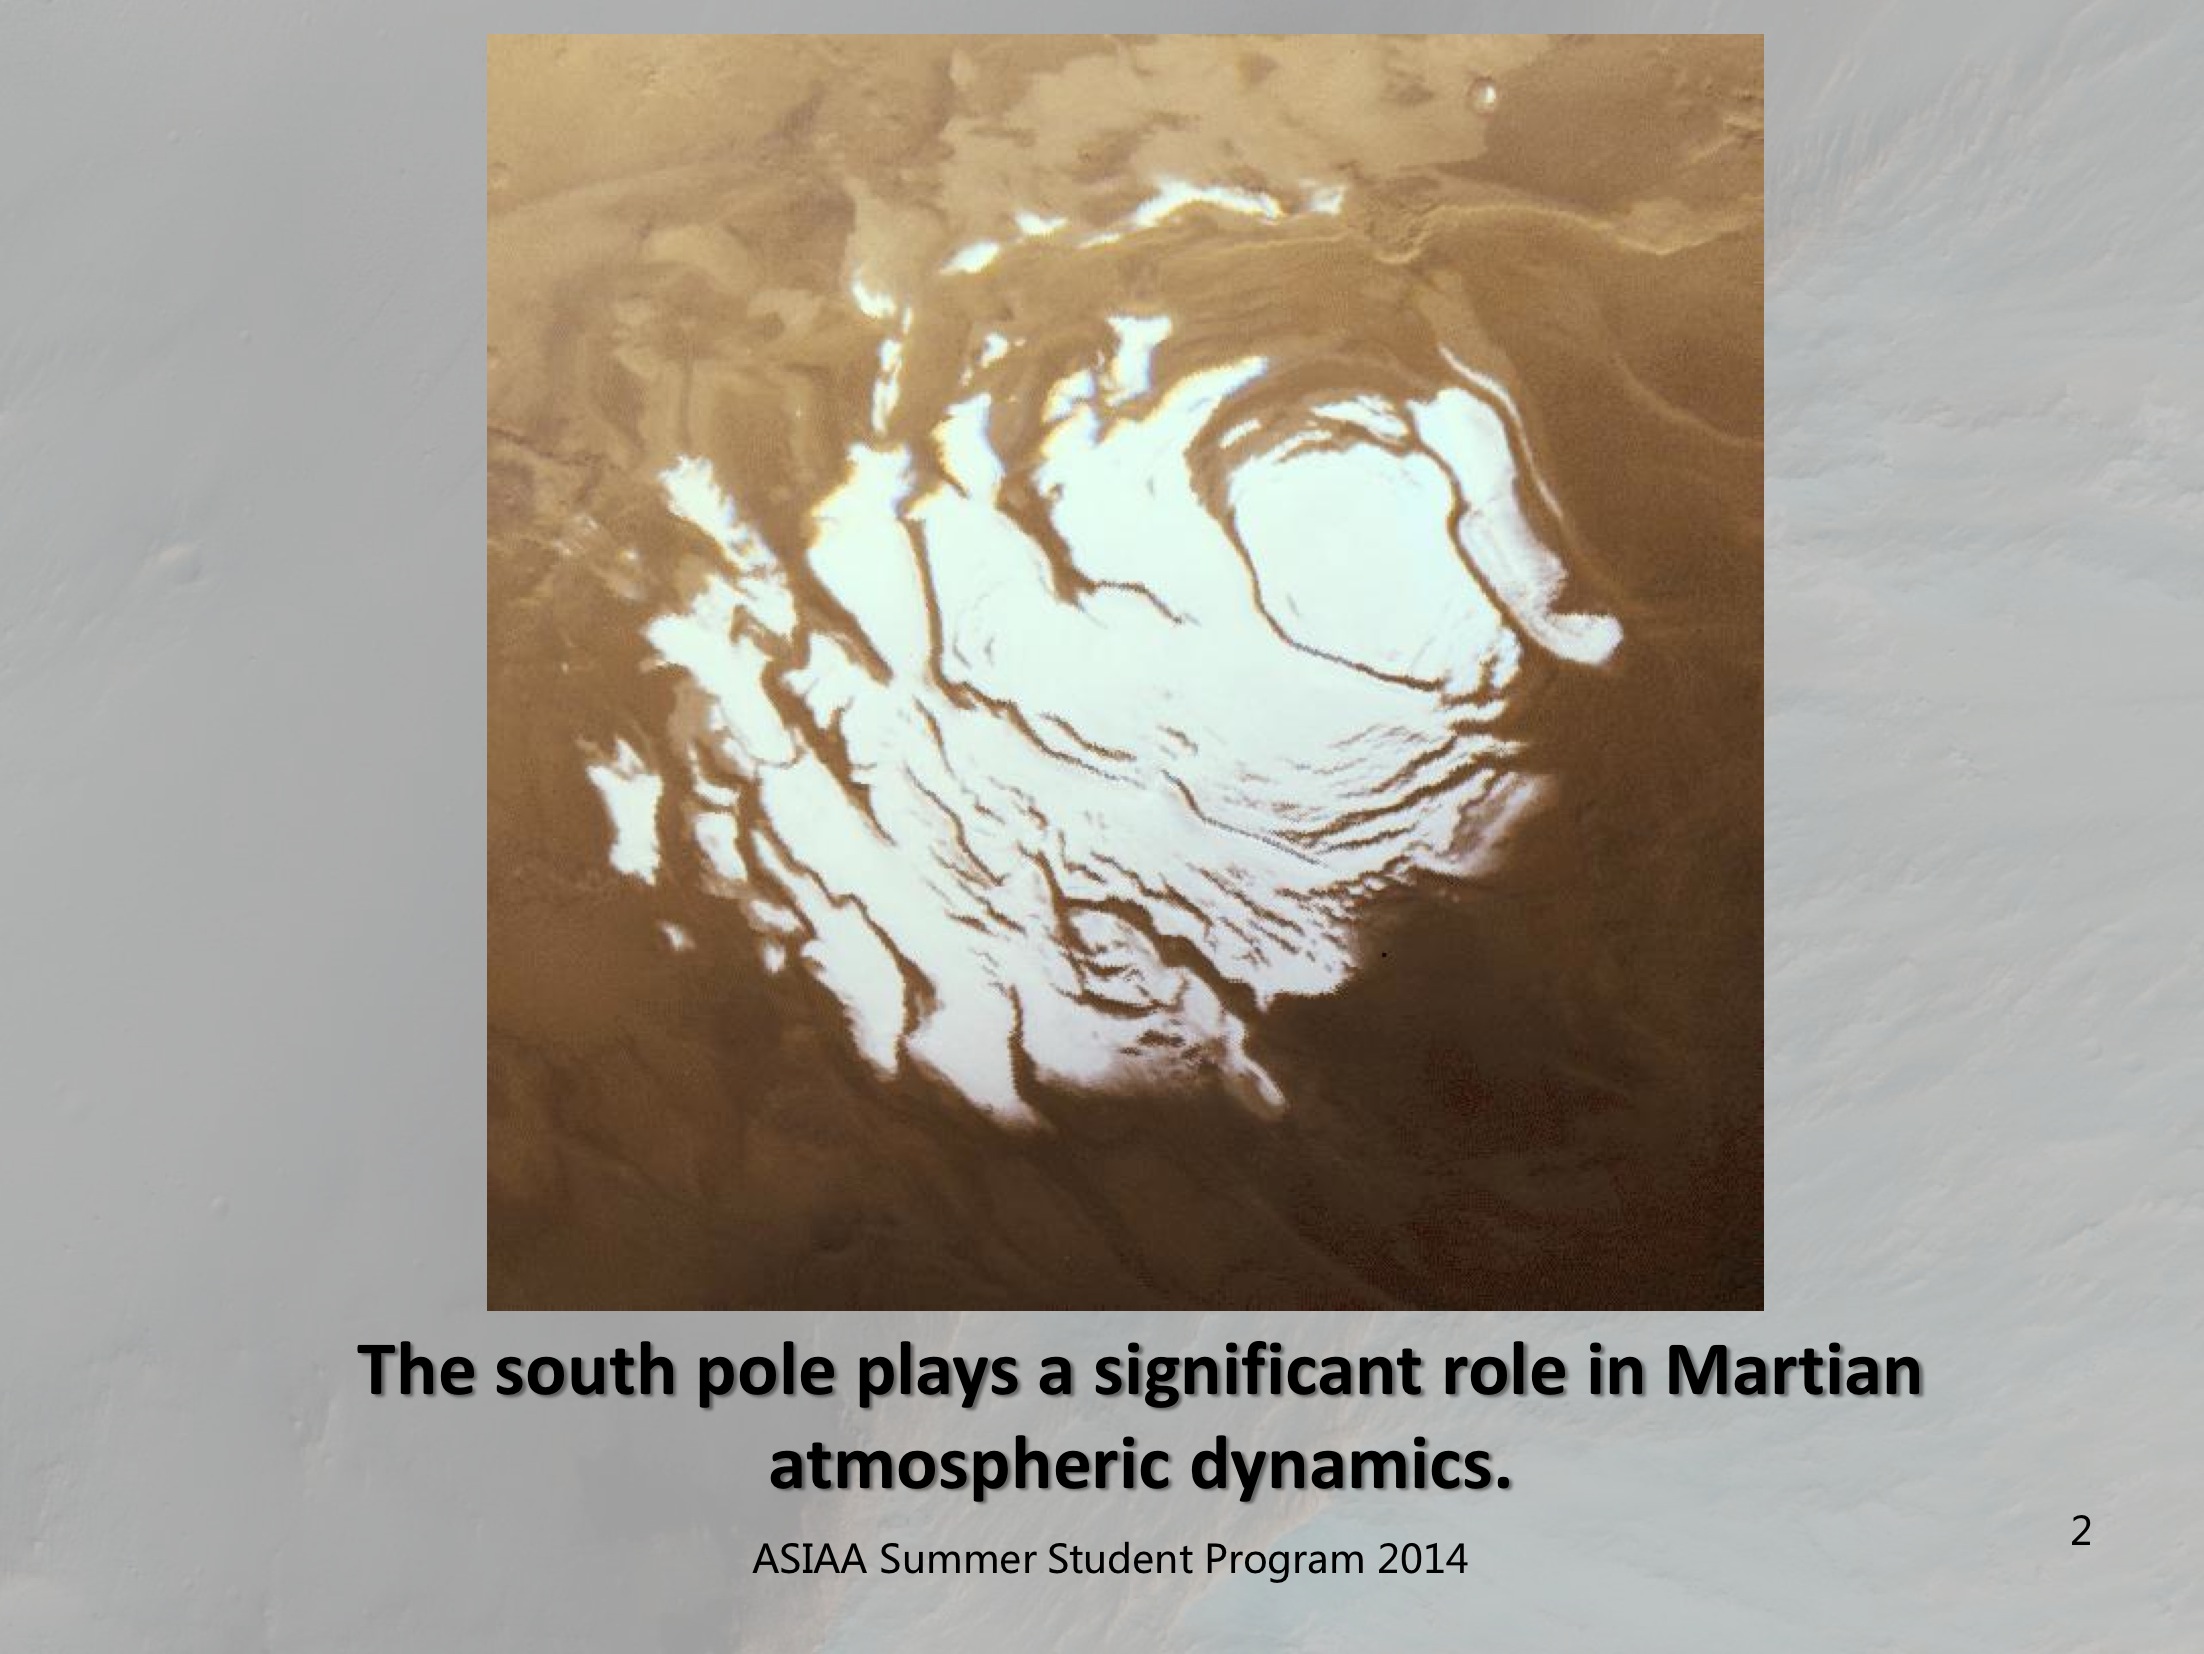 Mars has a very thin atmosphere, 96% of which is . Every year, the two poles of Mars participate in the gas exchange of atmosphere. Since the south pole contains a lot of , it plays an significant role in Martian atmospheric dynamics.
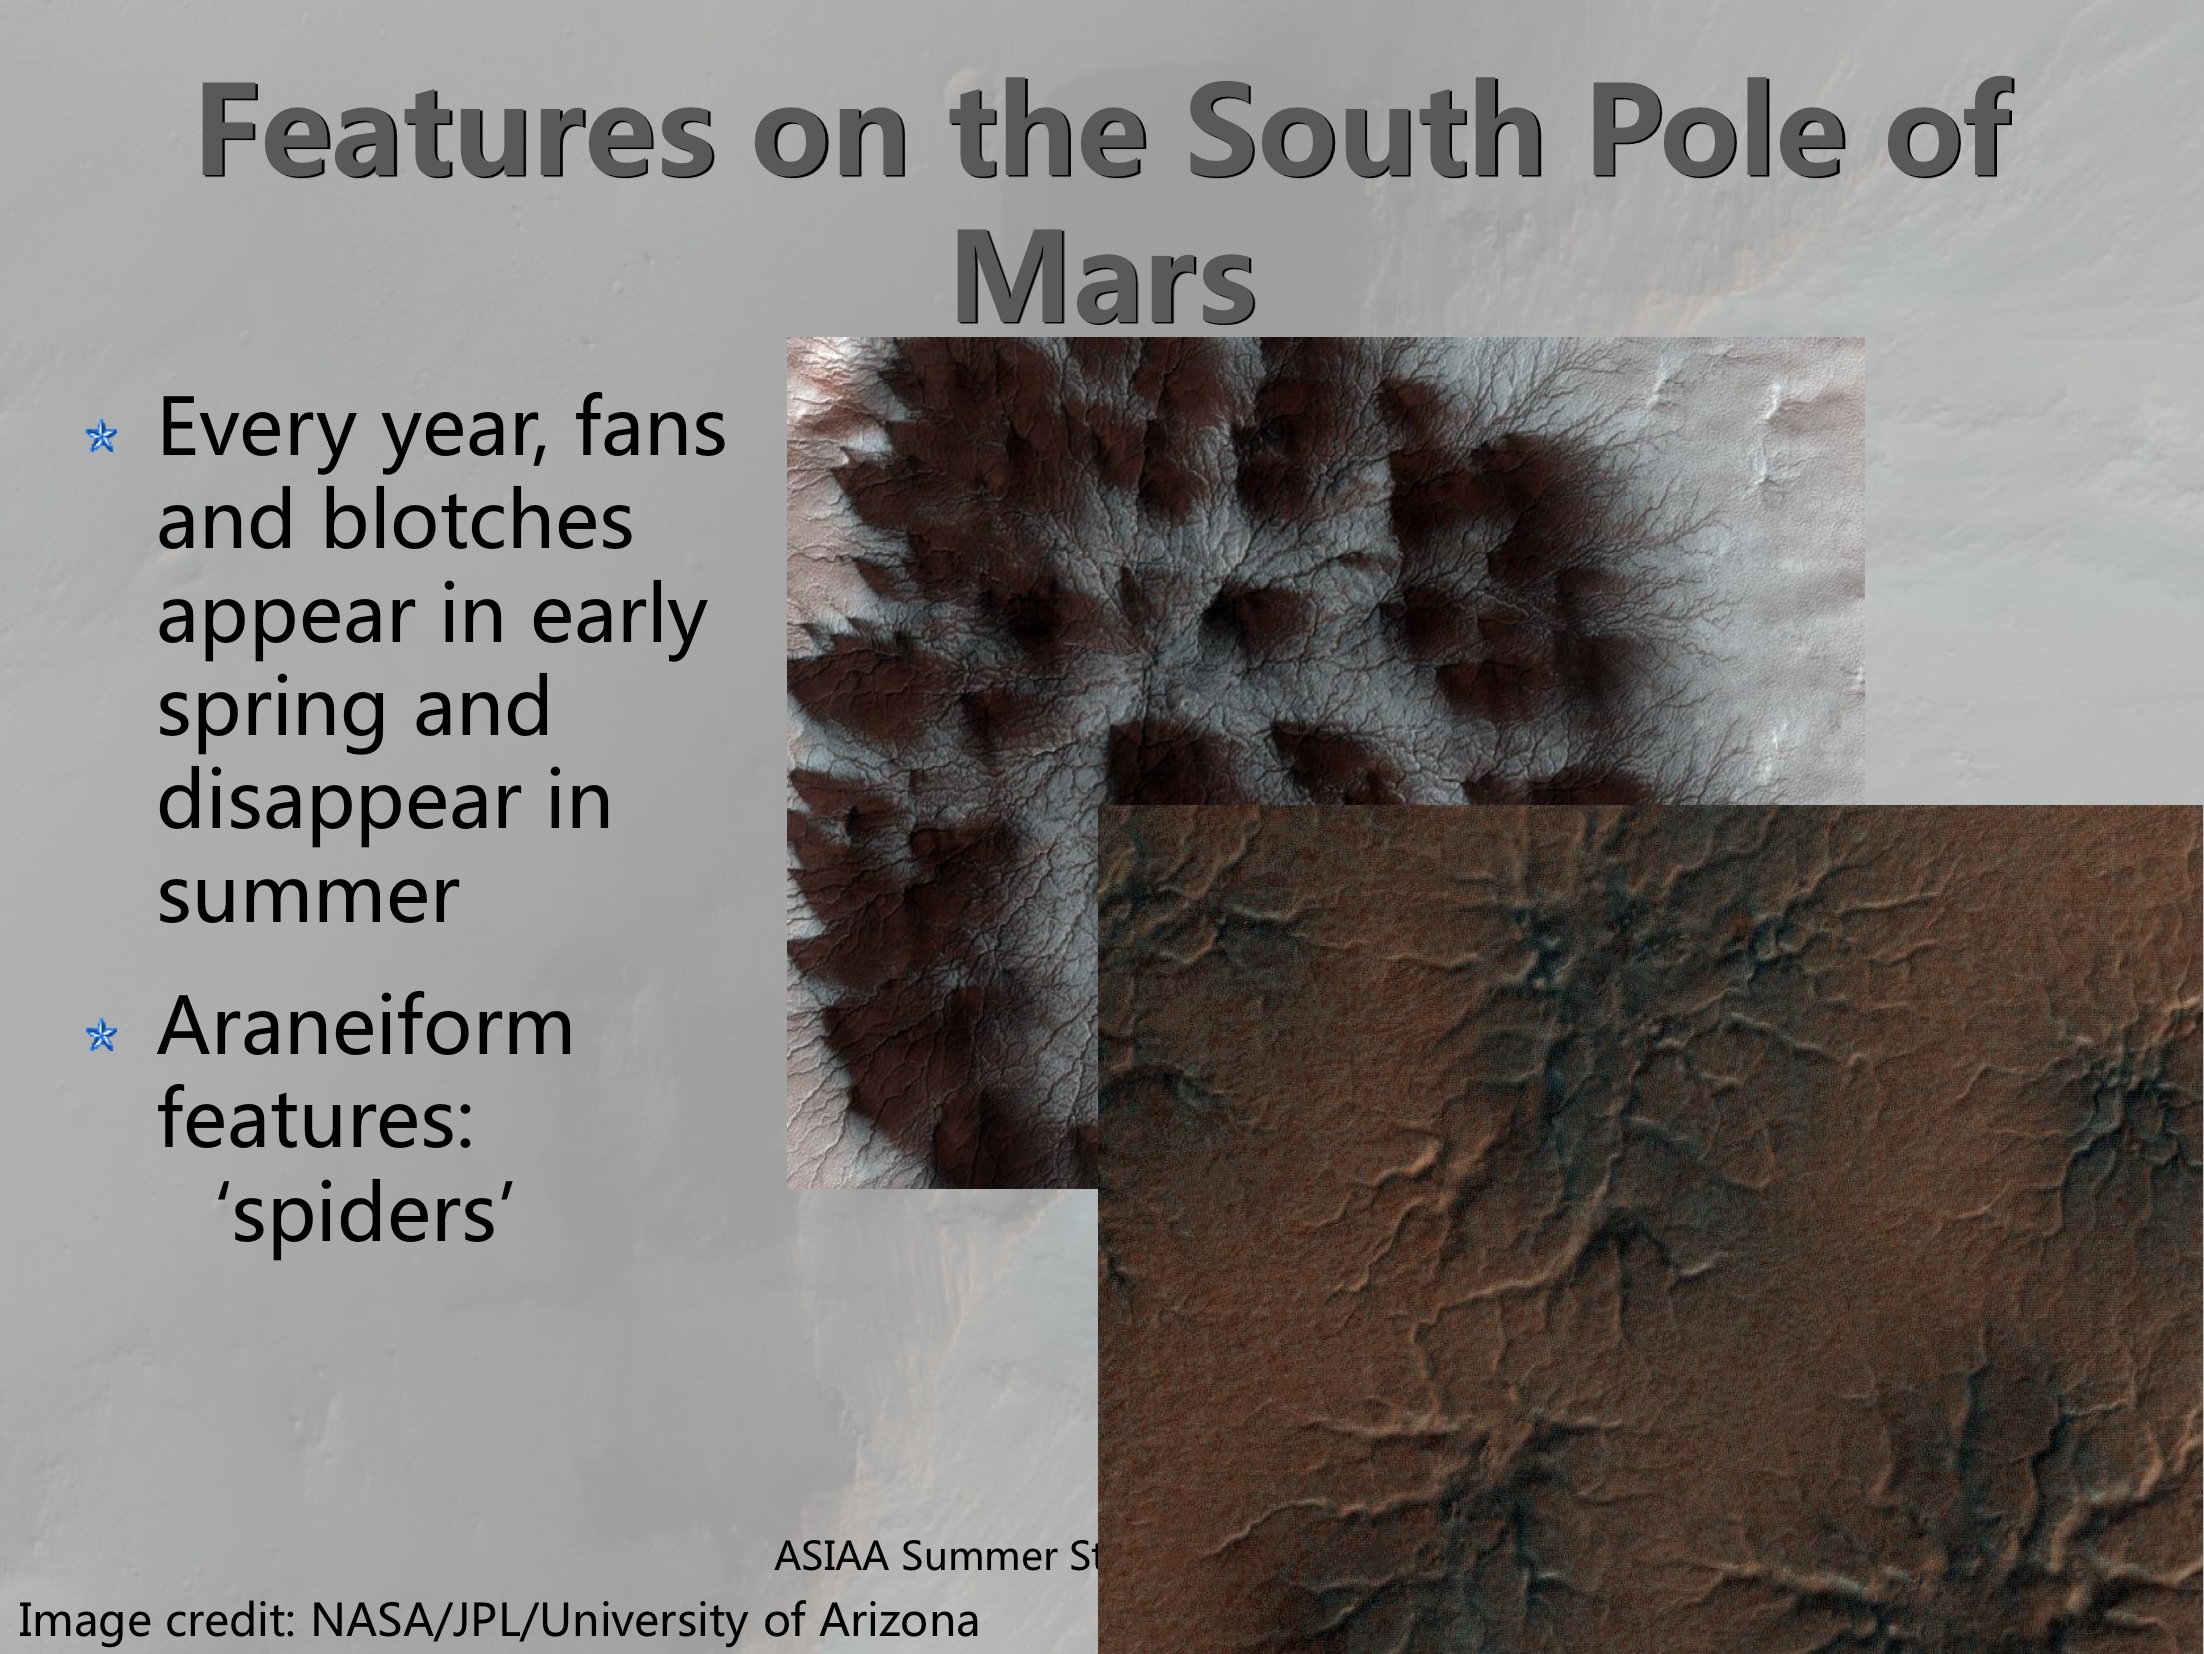 But what’s really interesting is we observe fans and blotches appear in early spring and disappear in summer each year on the south pole. Araneiform features or ‘spiders’, which are radial channels that converge in the center, often accompany those dark stuff.
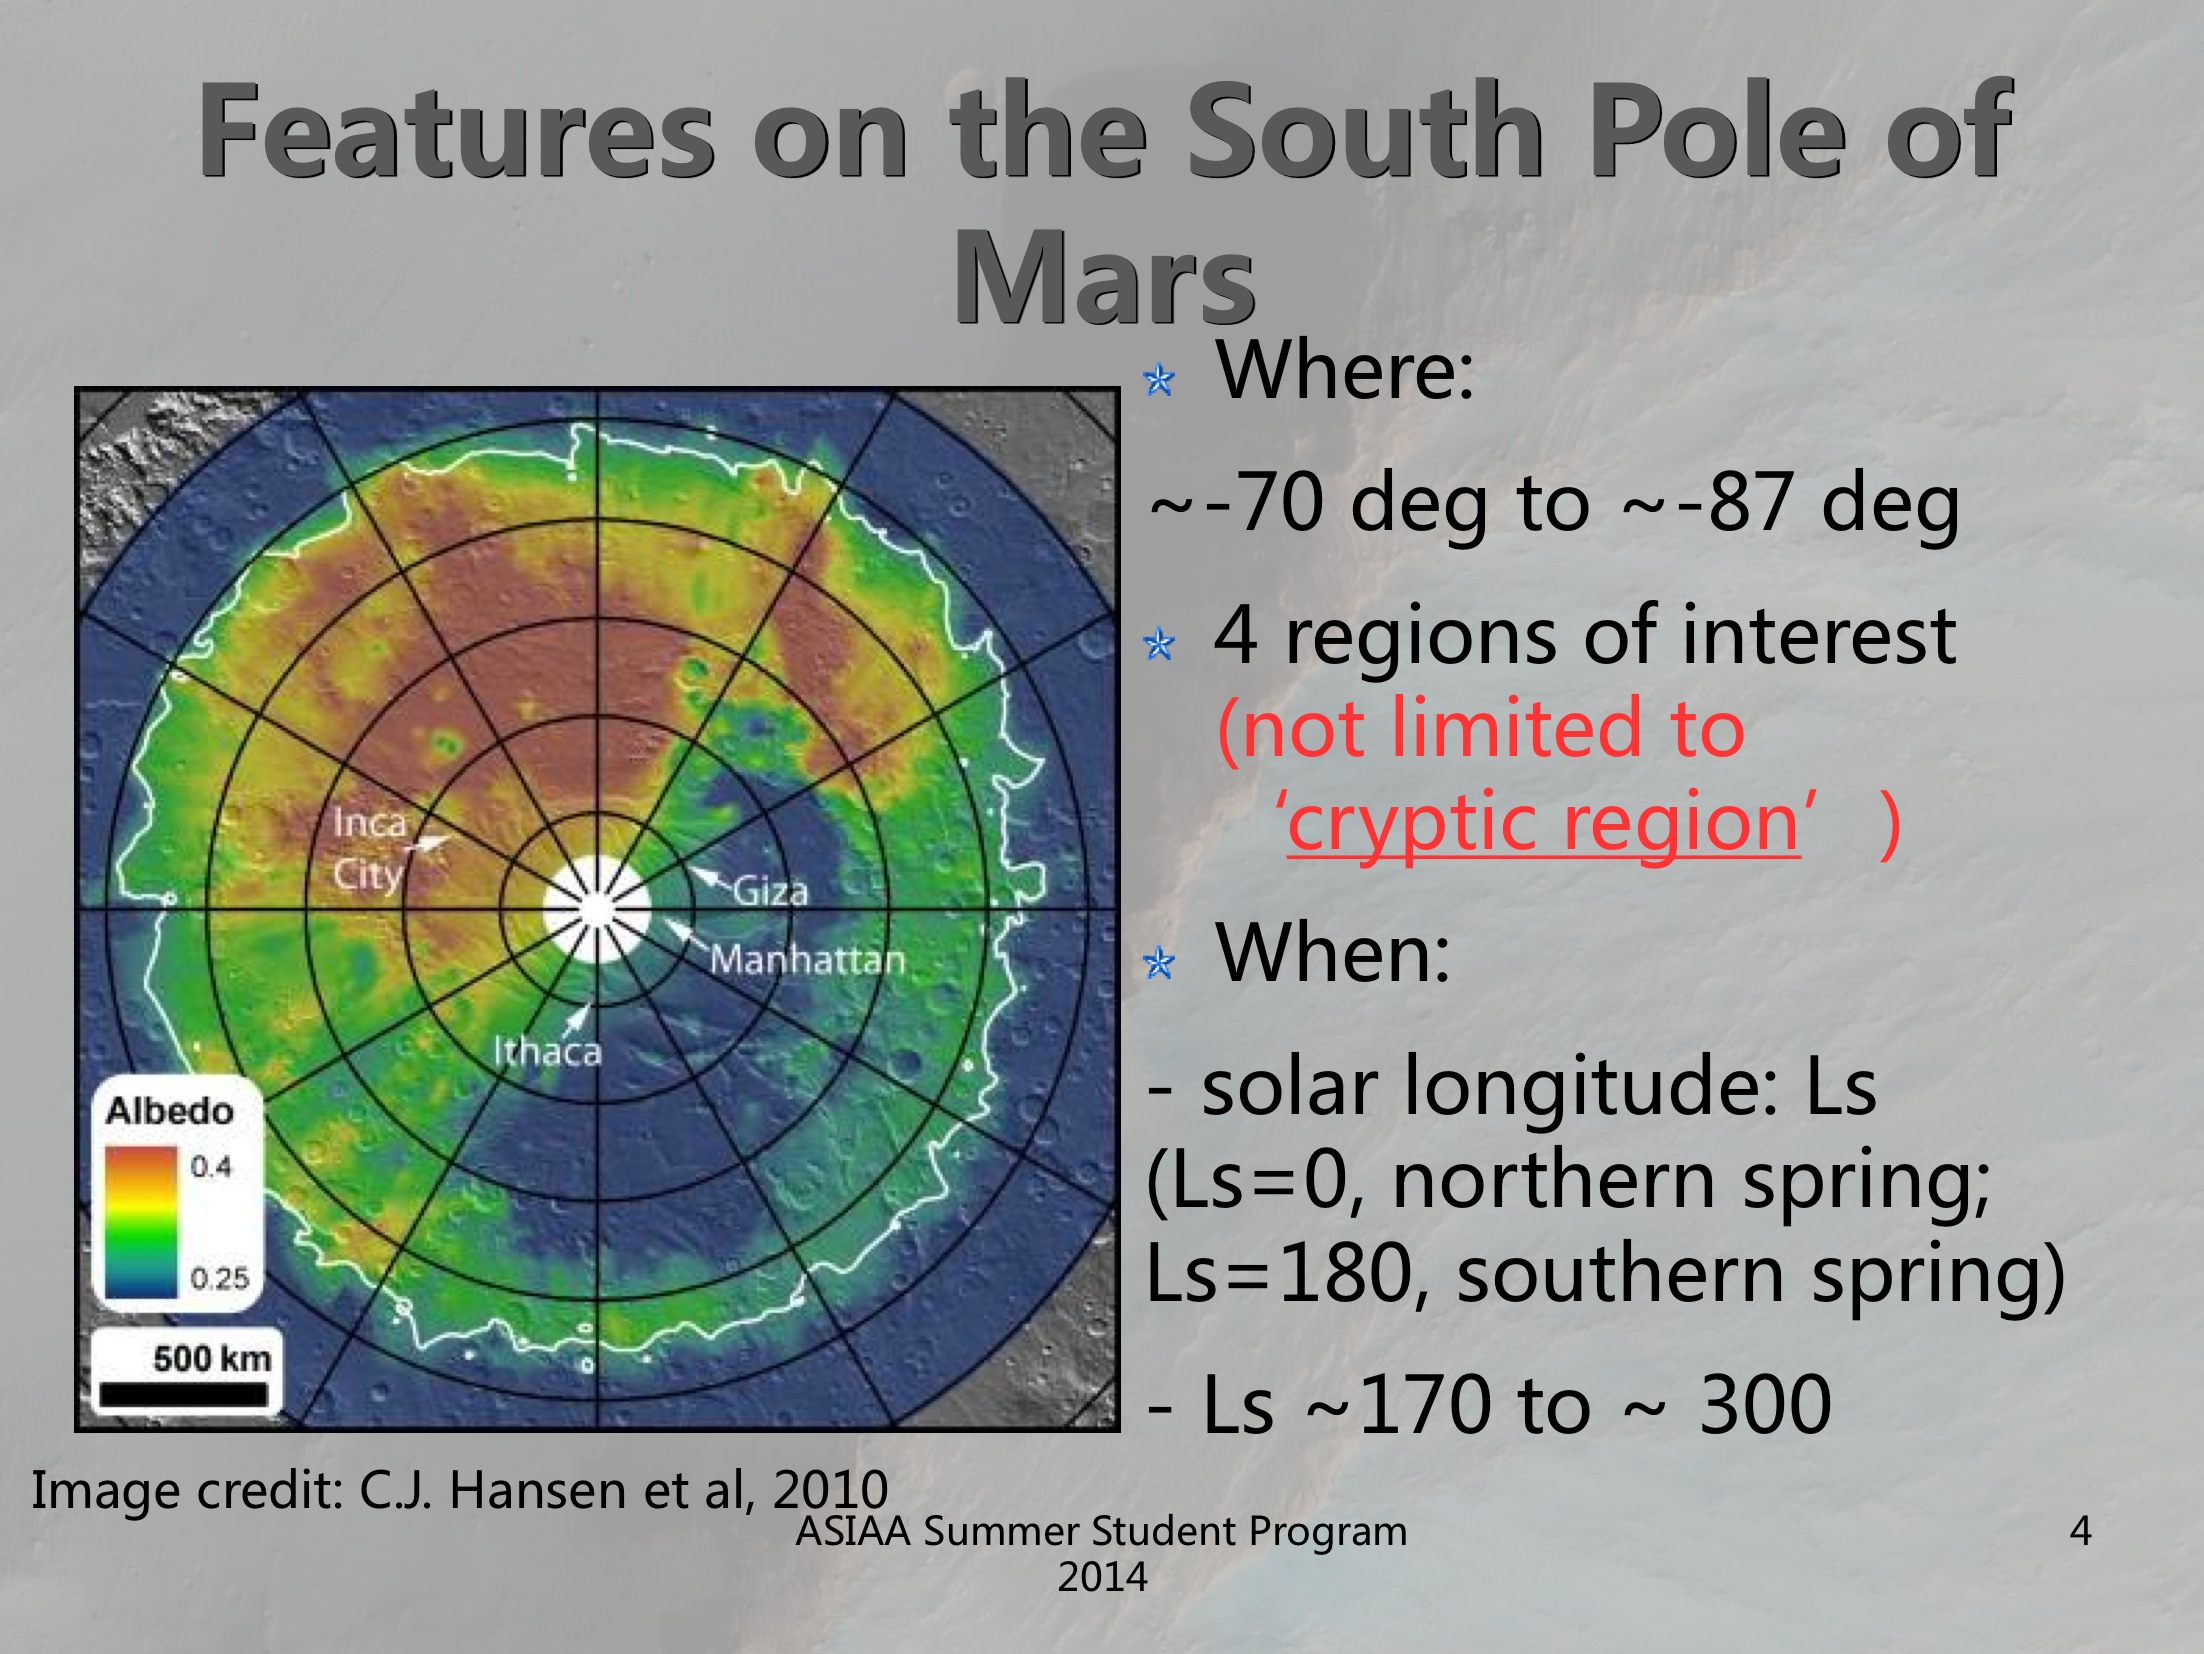 These features are everywhere from -70 to -87 deg. and not limited to the ‘cryptic region’ (low temperature because of dry ice, low albedo caused by translucent ice layer) as thought before. We use solar longitude (Ls) to measure time on Mars, these features appear from Ls 170 to Ls 300 typically.
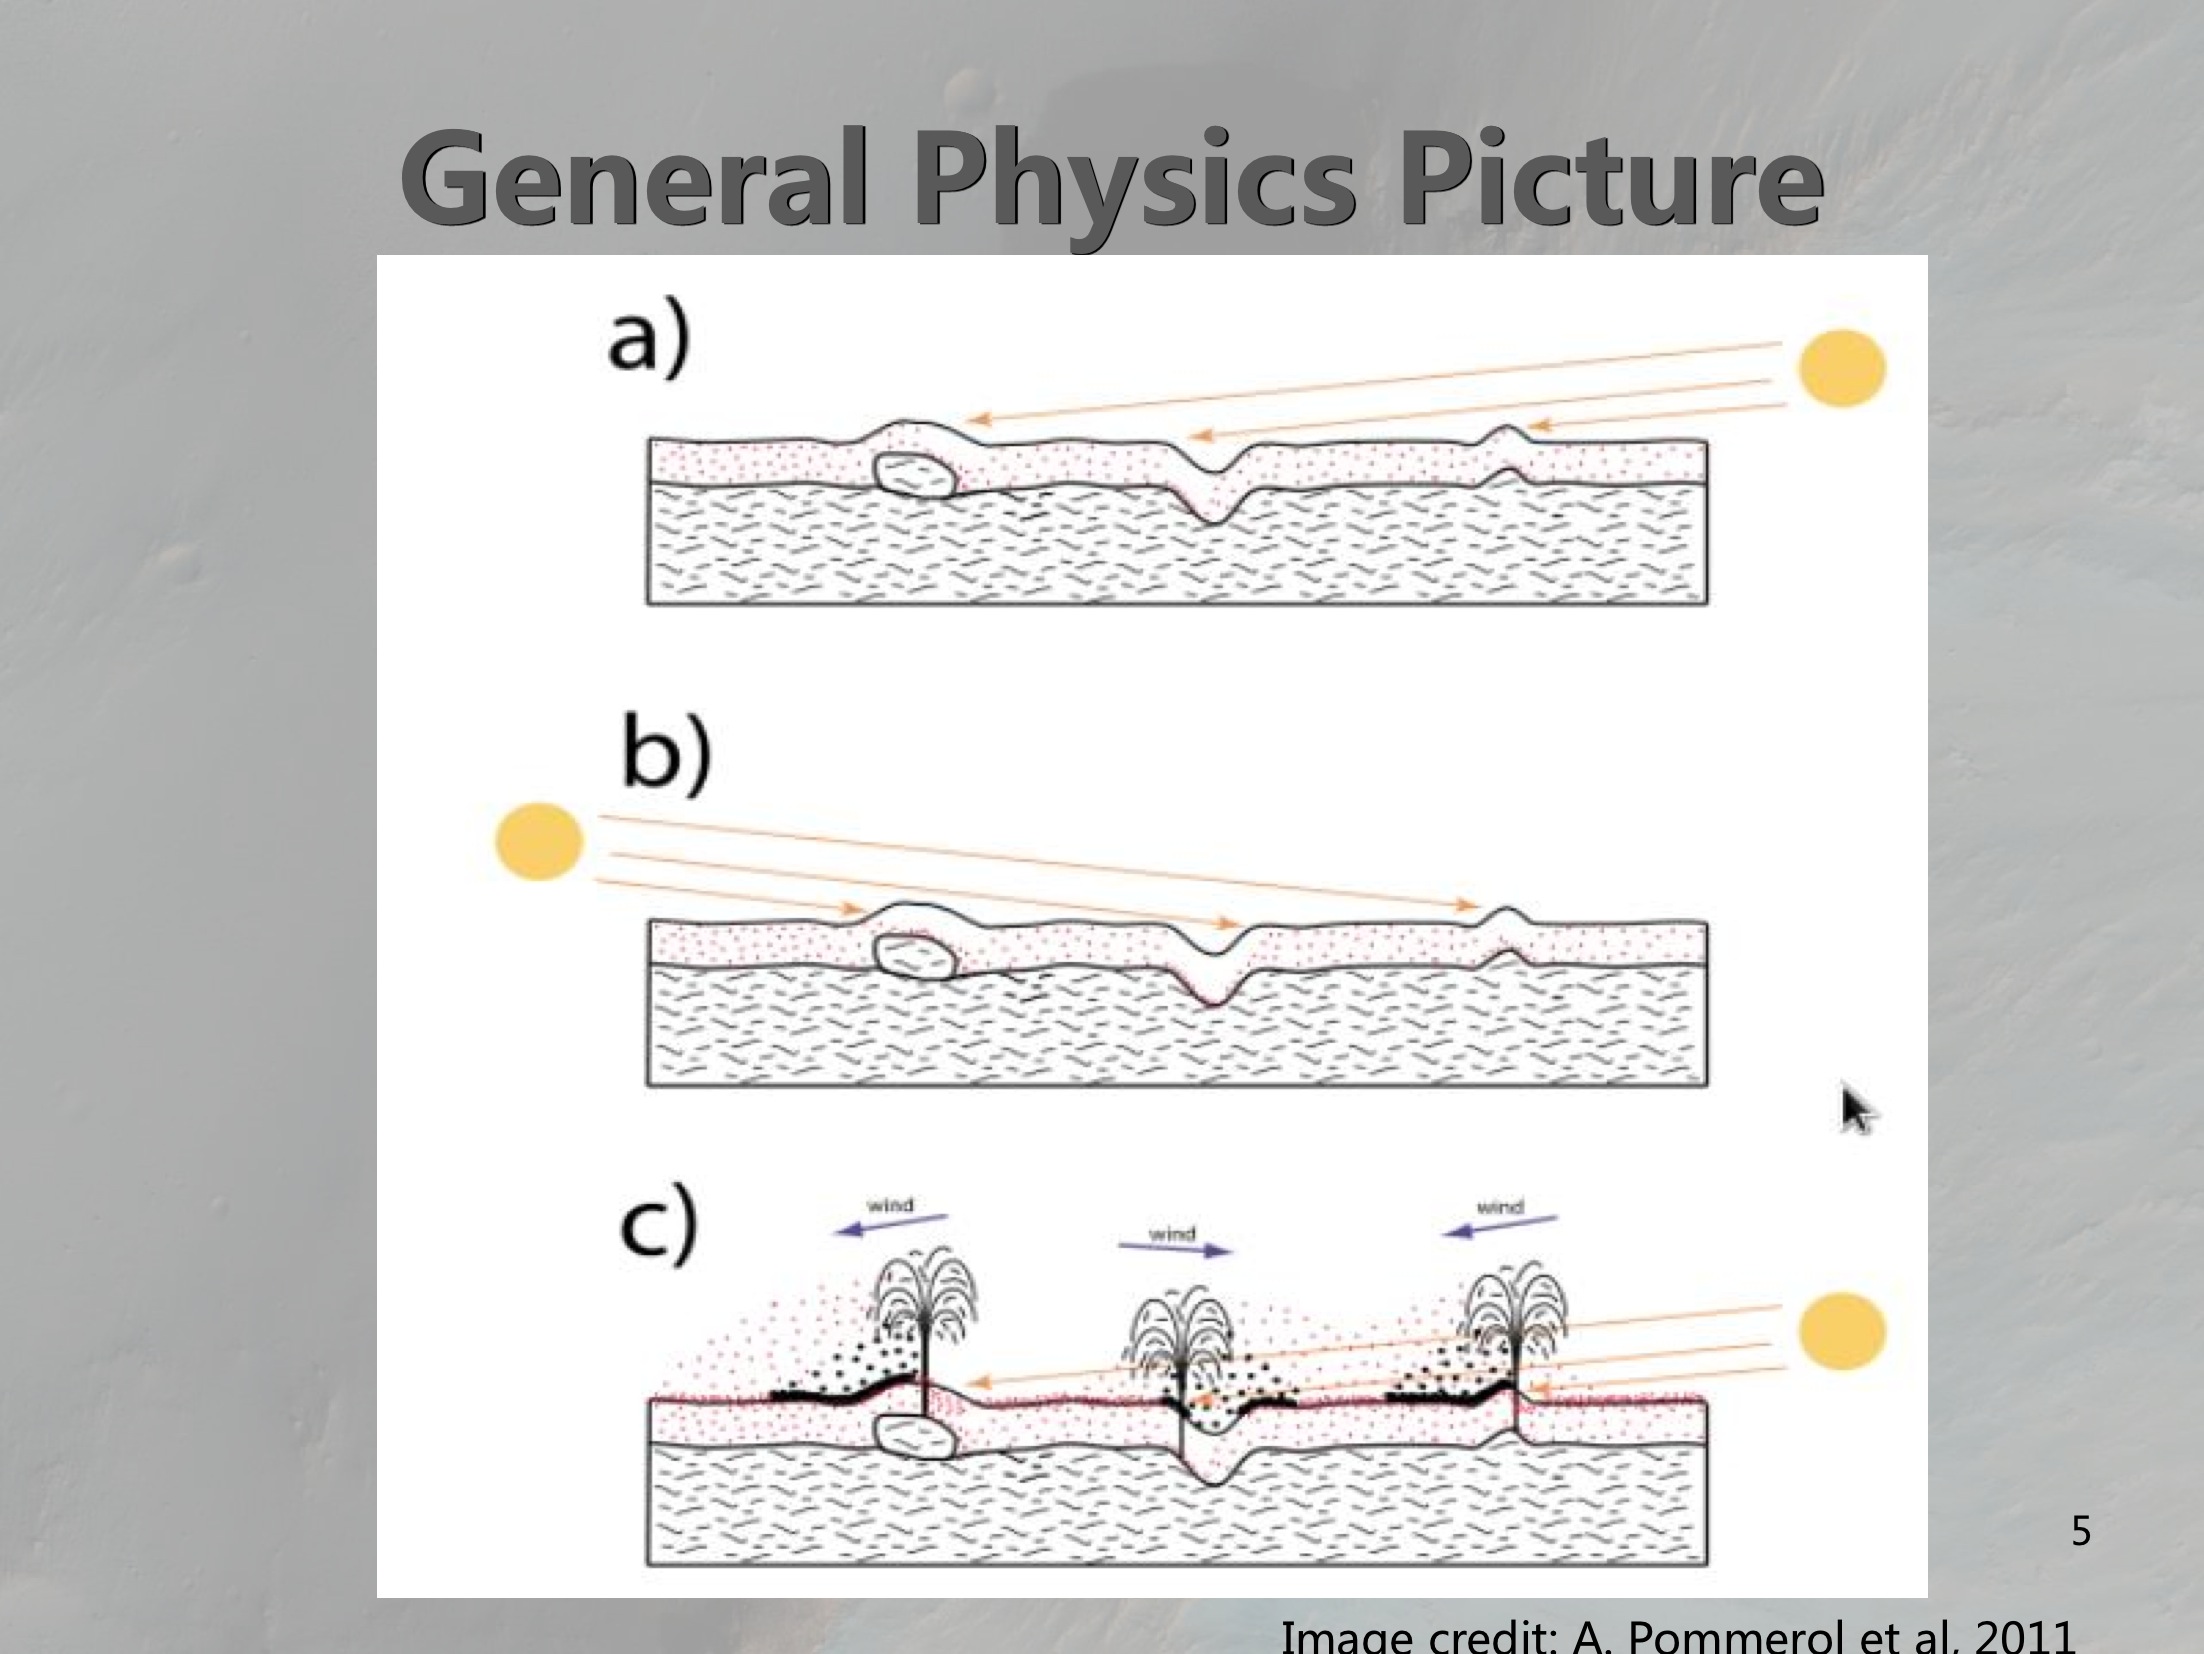 The basic idea of the formation of fans and blotches:
- In the southern winter, in the atmosphere tends to condensate and dust grains serve as condensation nuclei. They fall onto the ground with and thus are embedded in the slab ice later. In spring, they are heated by the sun and heat the surrounding ice subsequently. These ice sublimate and form bubbles which then sink through the ice layer.
- With bubbles accumulate in the bottom, pressure between ice layer and the ground increase, so the ice could break and then jets of gas, together with dust, come out.
- Due to local topography and wind, the jets form fan-shaped deposits.
The gas beneath the ice layer might carve the Mars surface and form ‘spiders’.
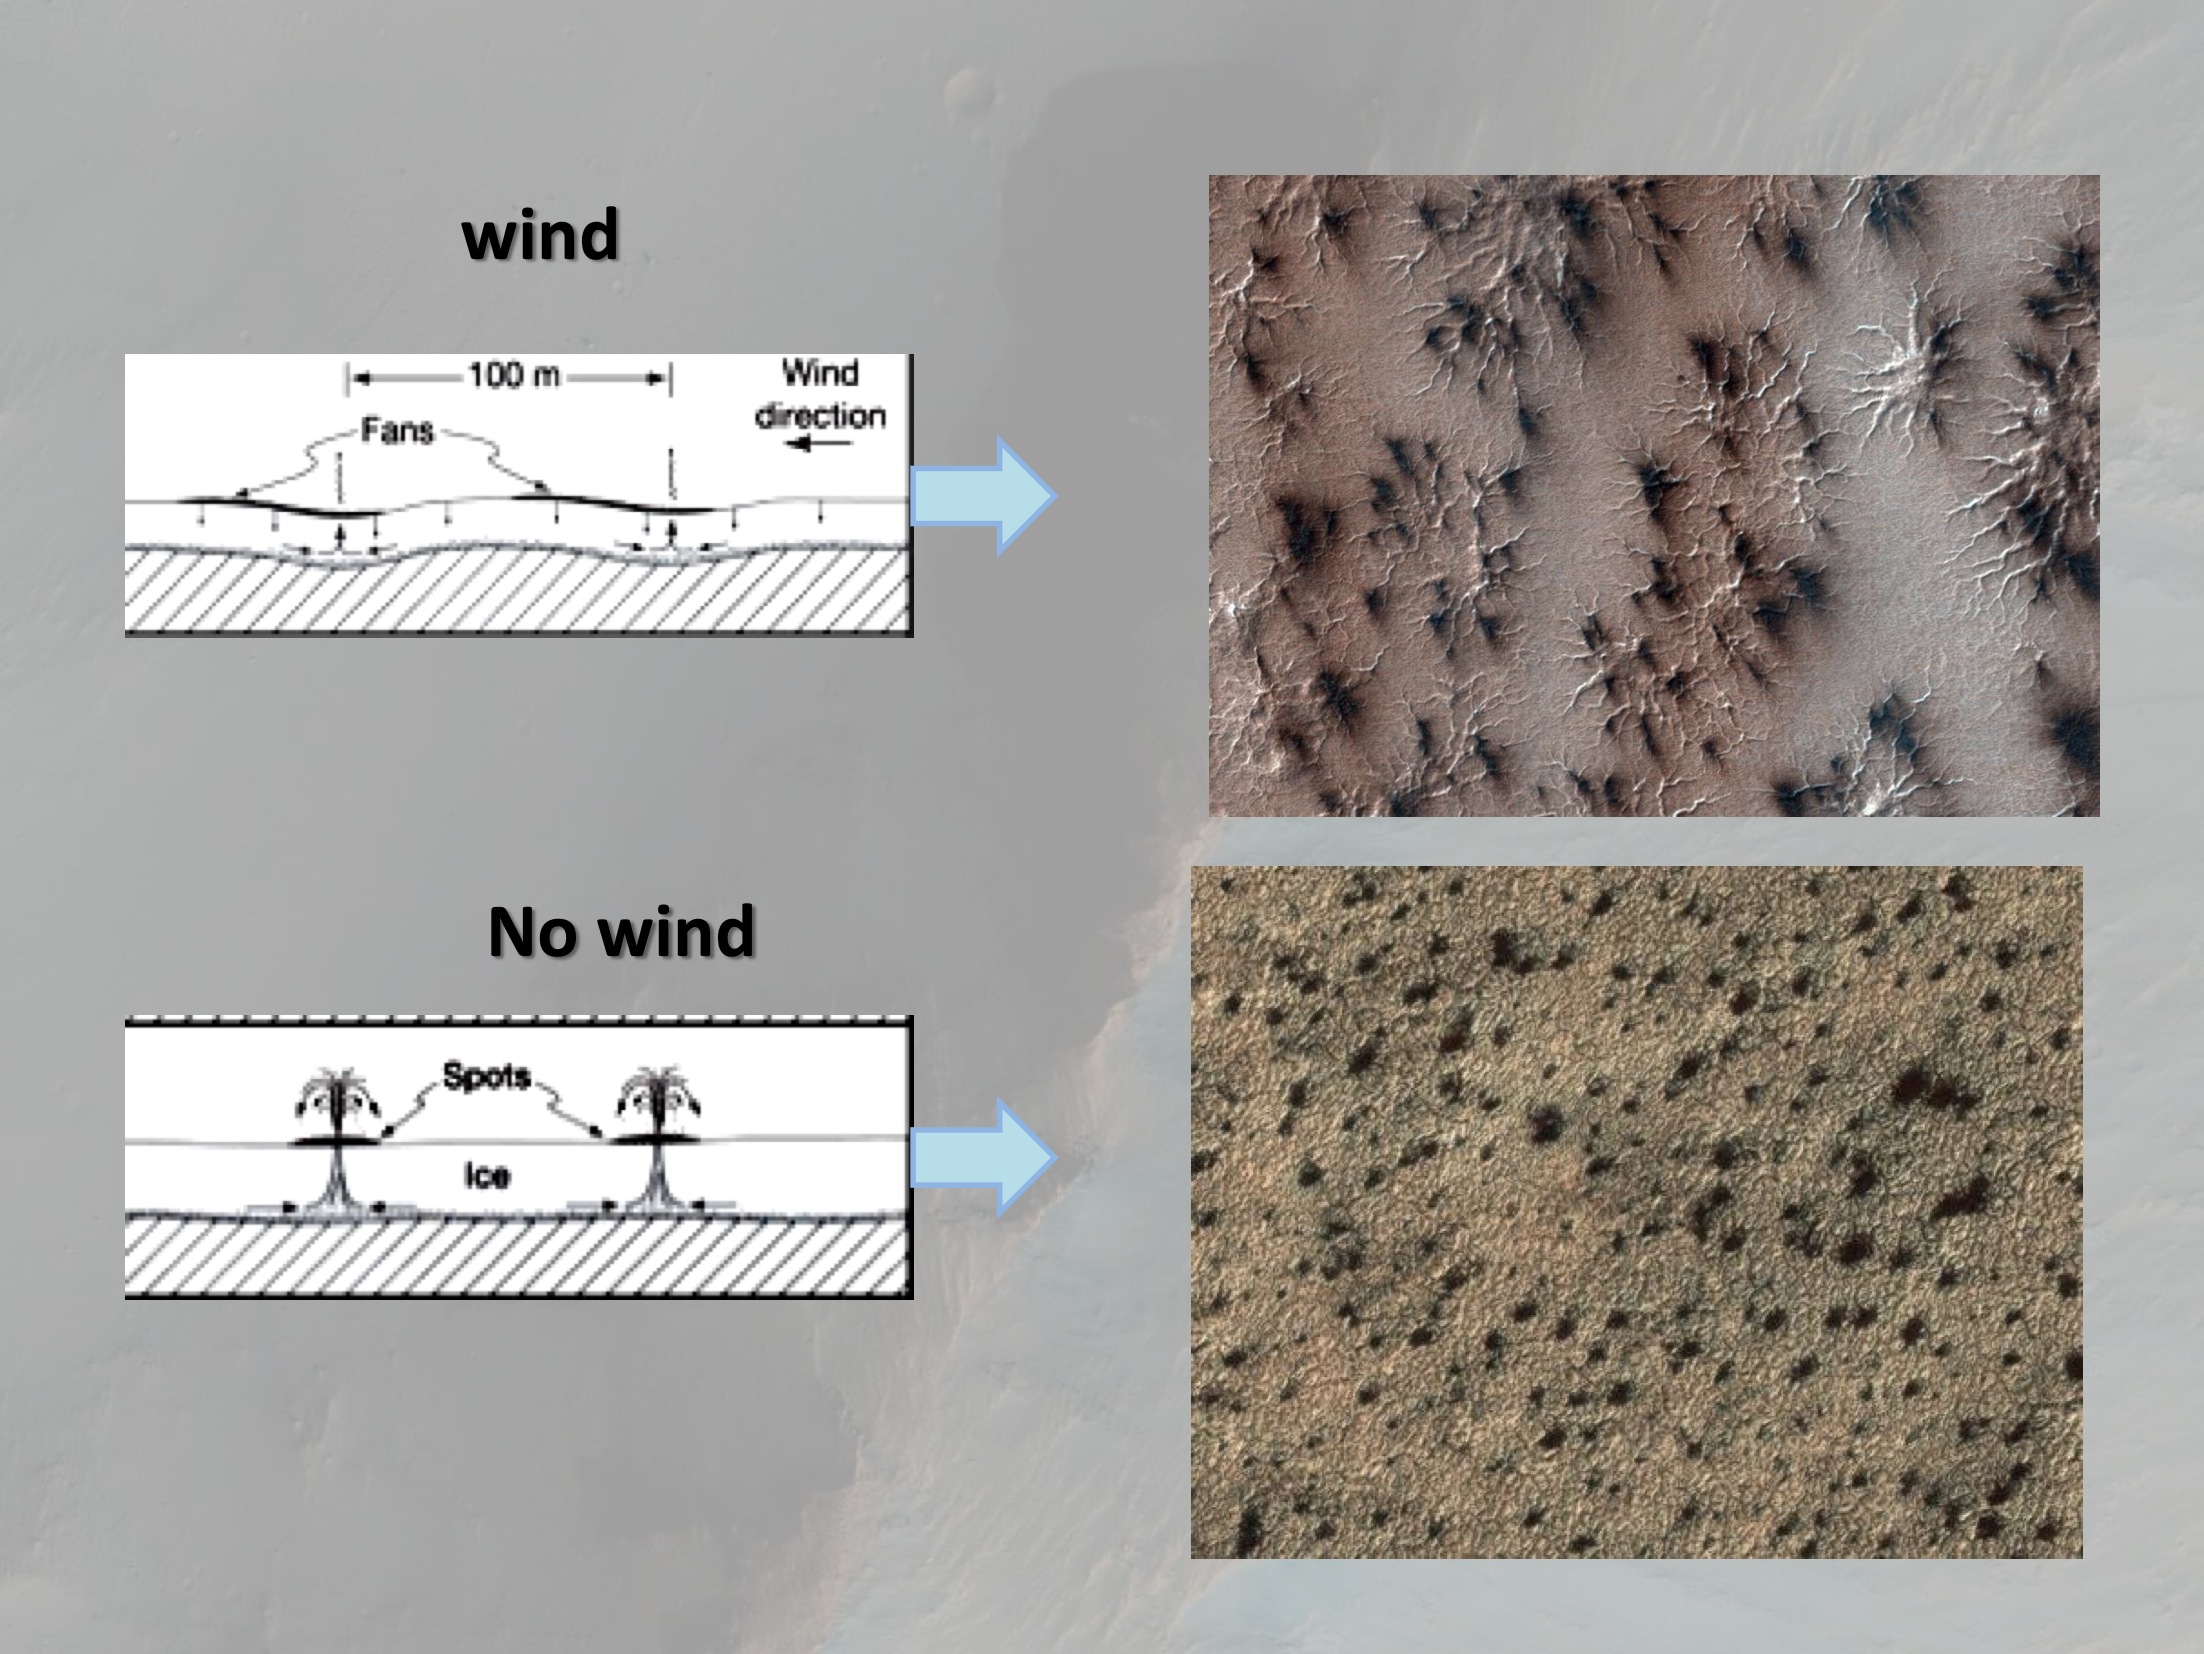 With local wind, the deposits look like fans with orientation that can indicate the direction of wind. Without wind to blow down the material, the deposits become blotches.
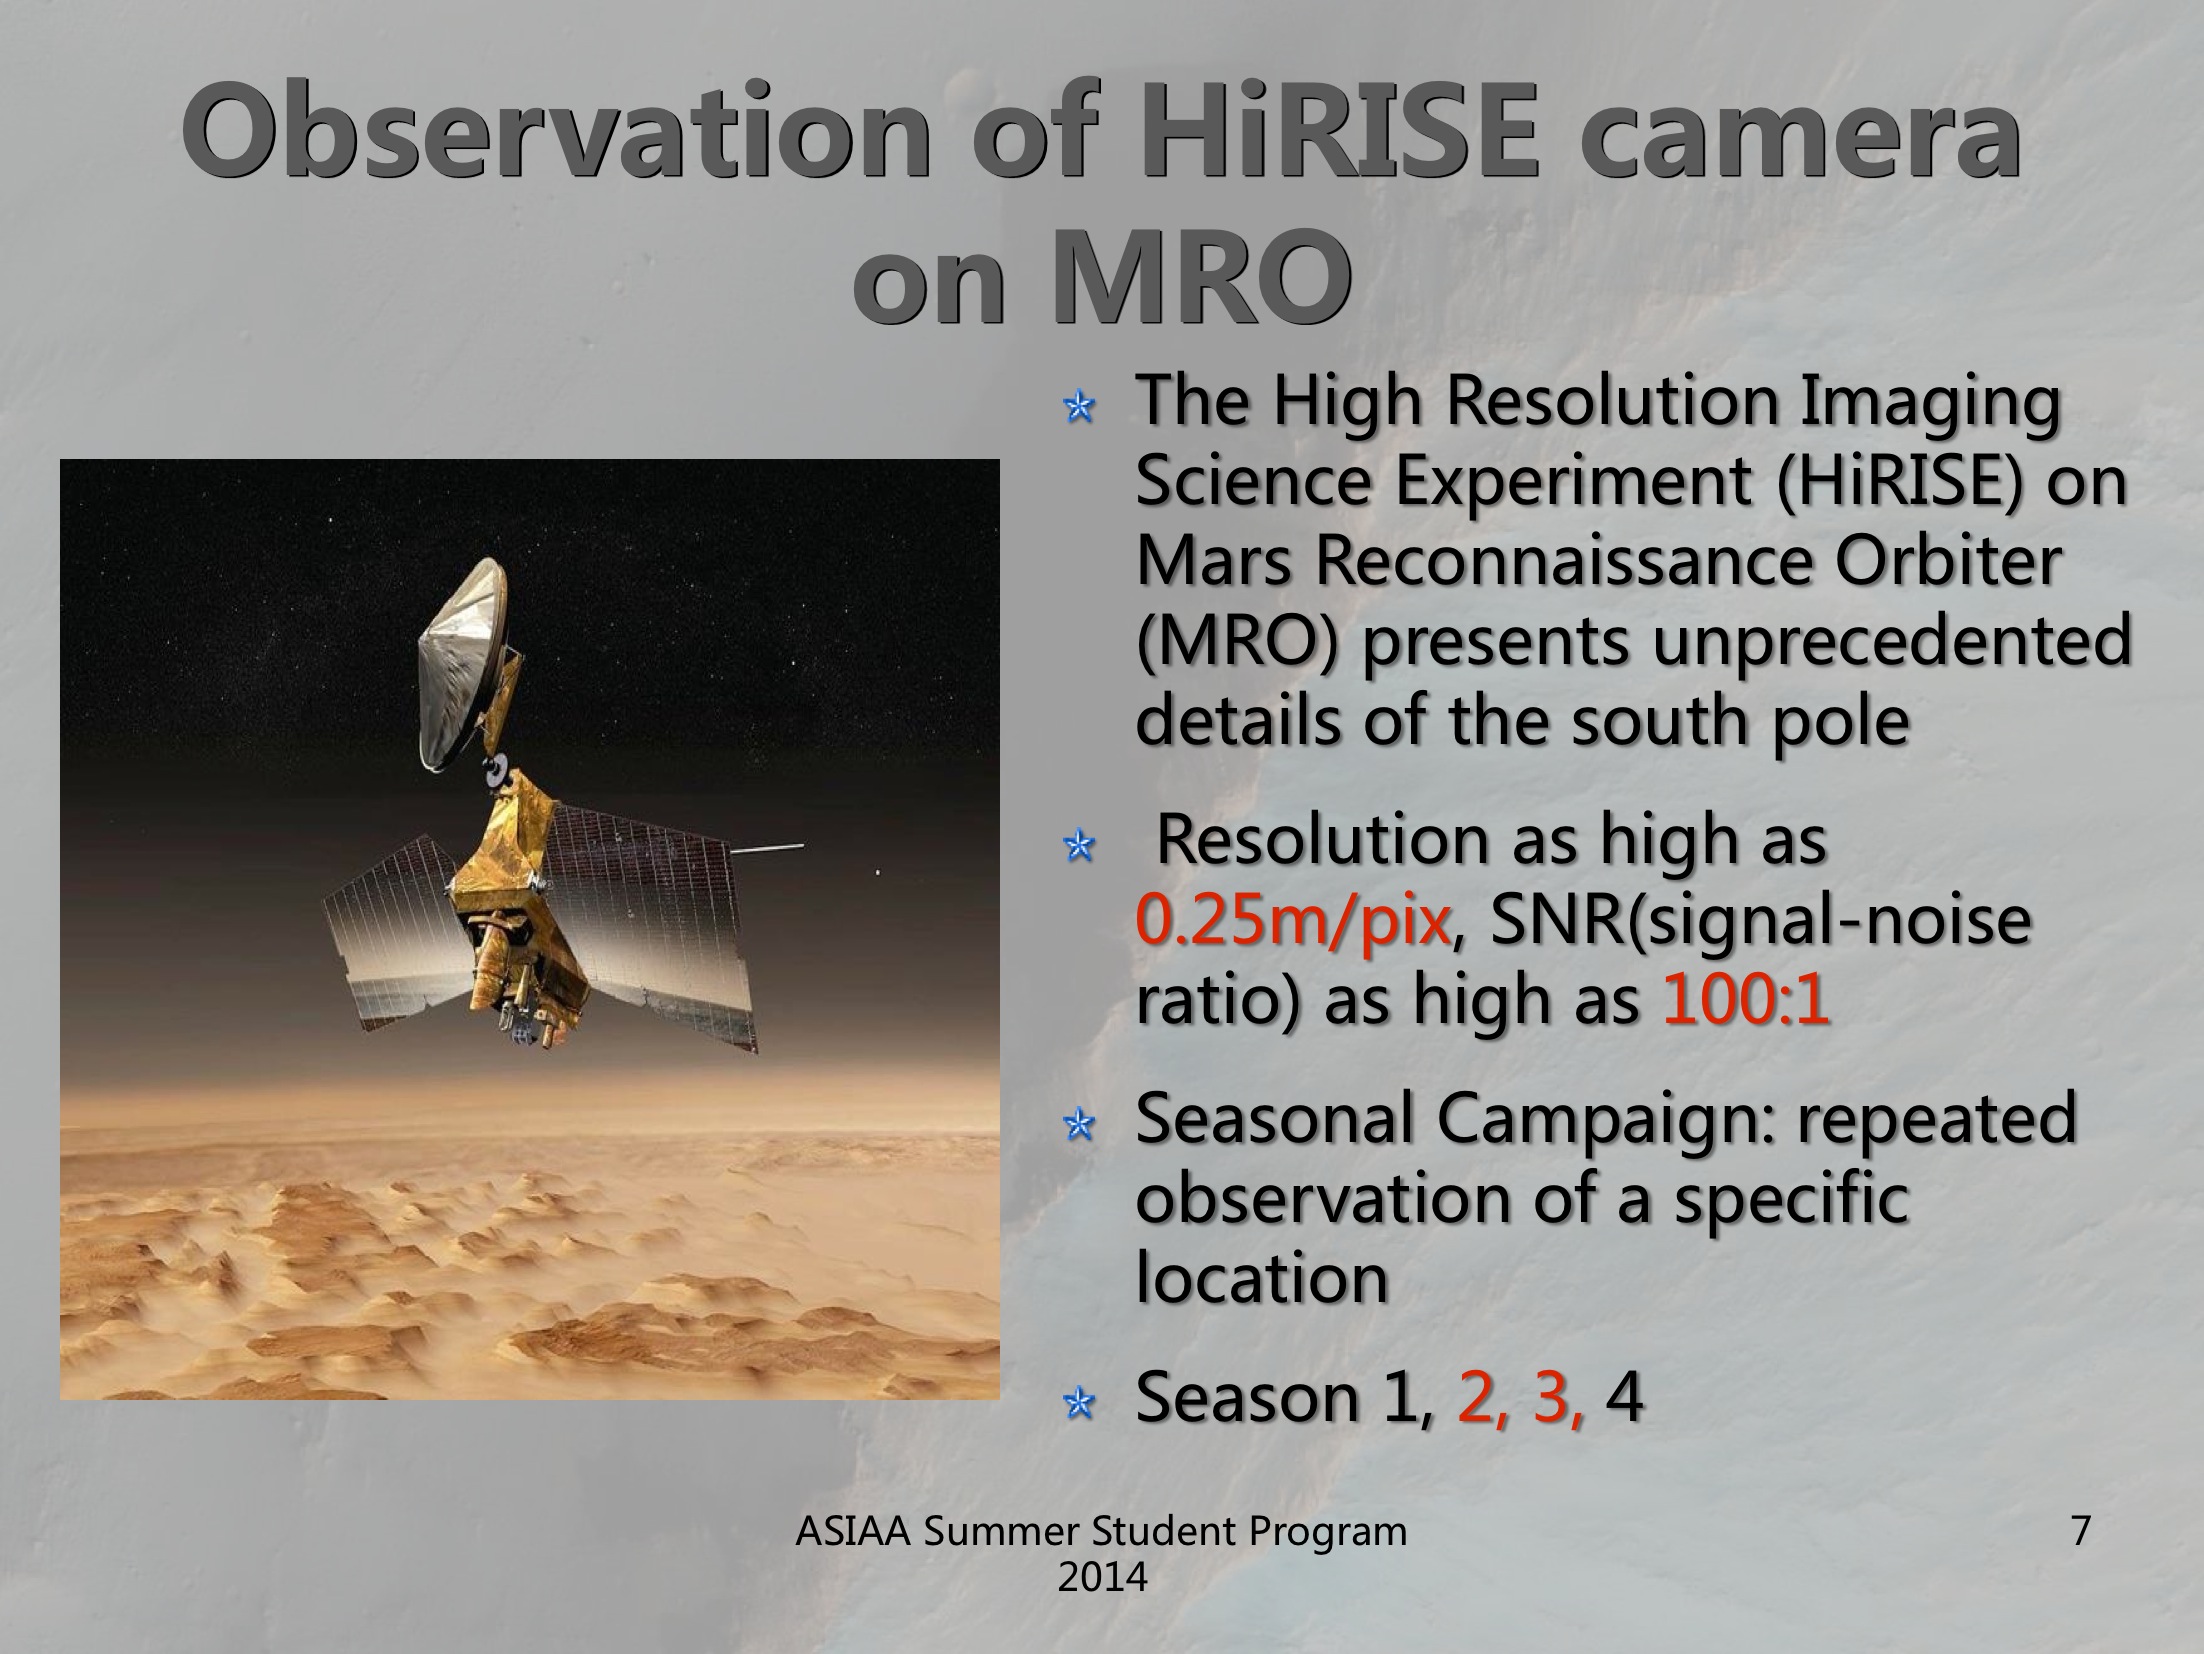 We now have a powerful instrument to study such features. The HiRISE camera on MRO has resolution as high as 0.25m per pixel and excellent SNR (100:1). So we can study sub-meter objects like boulders on Mars. It’s able to observe same locations at different time and thus show the evolution of the south pole. It has finished 4 seasons of observation. Season is 2006-2007, season 2 is 2008-2009, etc.
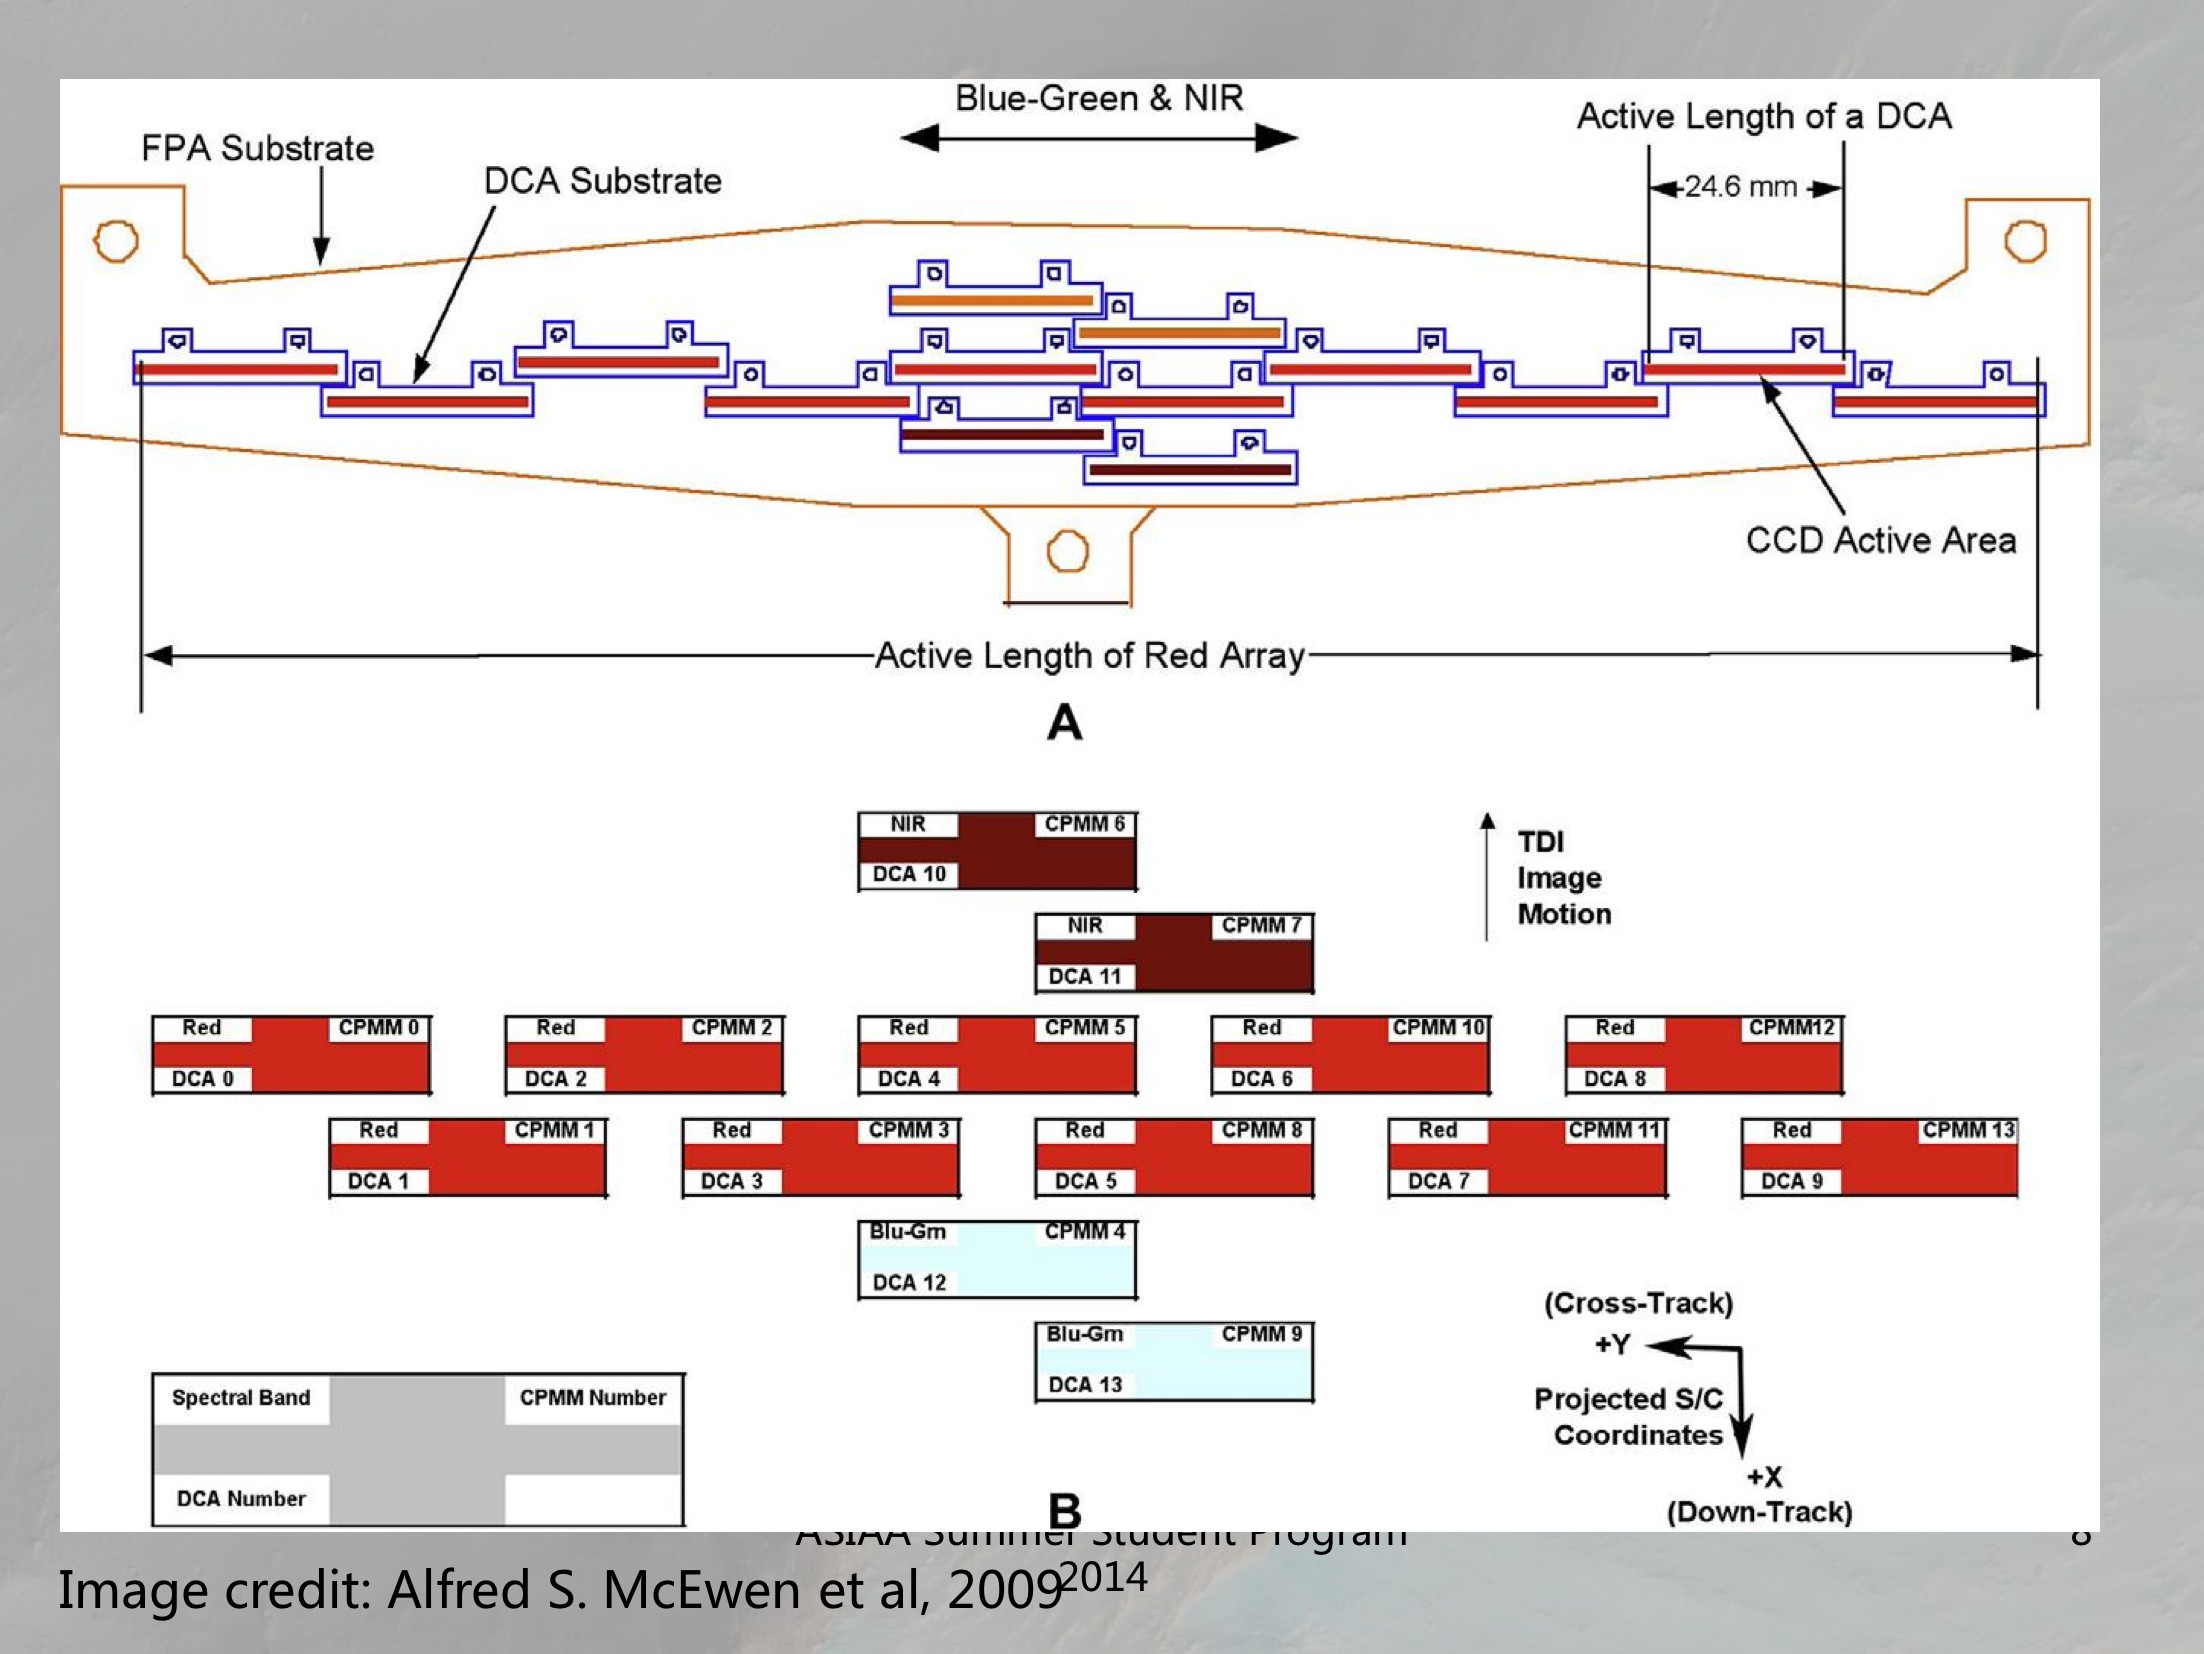 This schematic show you what the focal plane of HIRISE is like. There are 10 RED CCDs, 2 NIR, 2 BG. So color images can be obtained in the middle of the focal plane. Note that there are overlaps between every 2 CCDs.
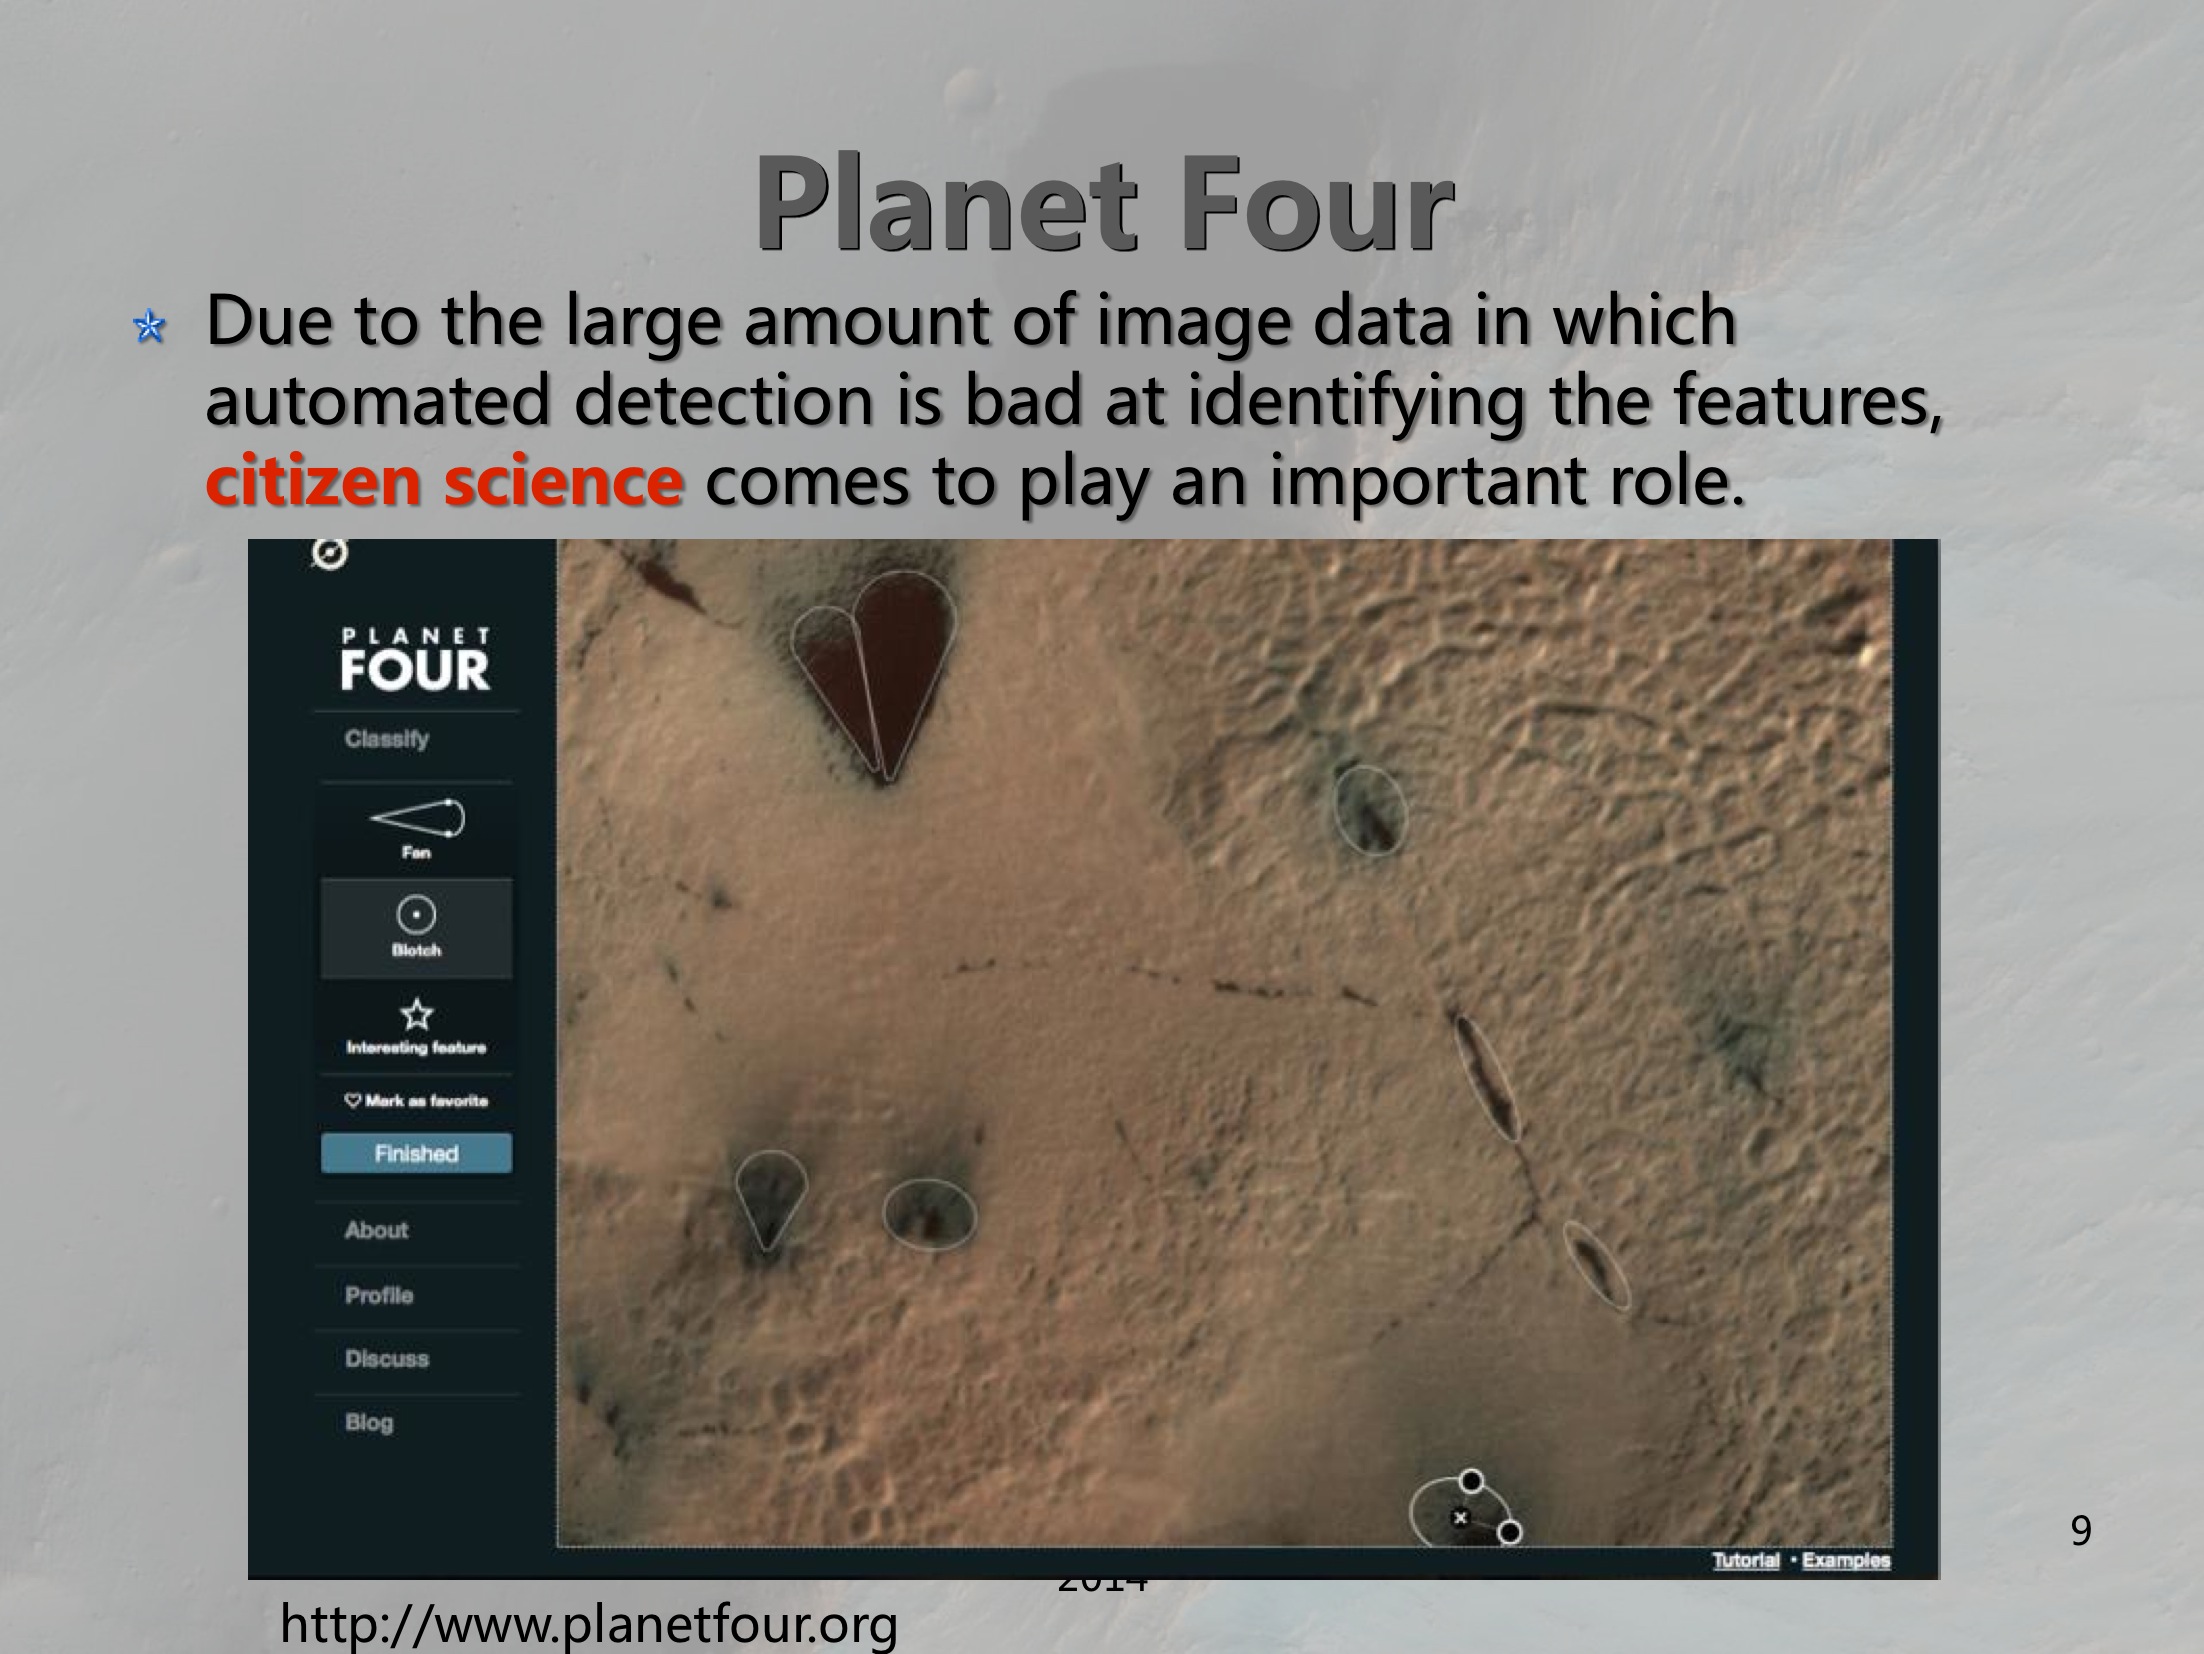 Though we have large amount of data from HiRISE, computers are bad at recognize the features in it. Thus we invite citizens on Earth to help marking them on Planet Four. It is a project under Zooniverse. Users can use the tools in the classification interface to mark features’ sources and orientation.
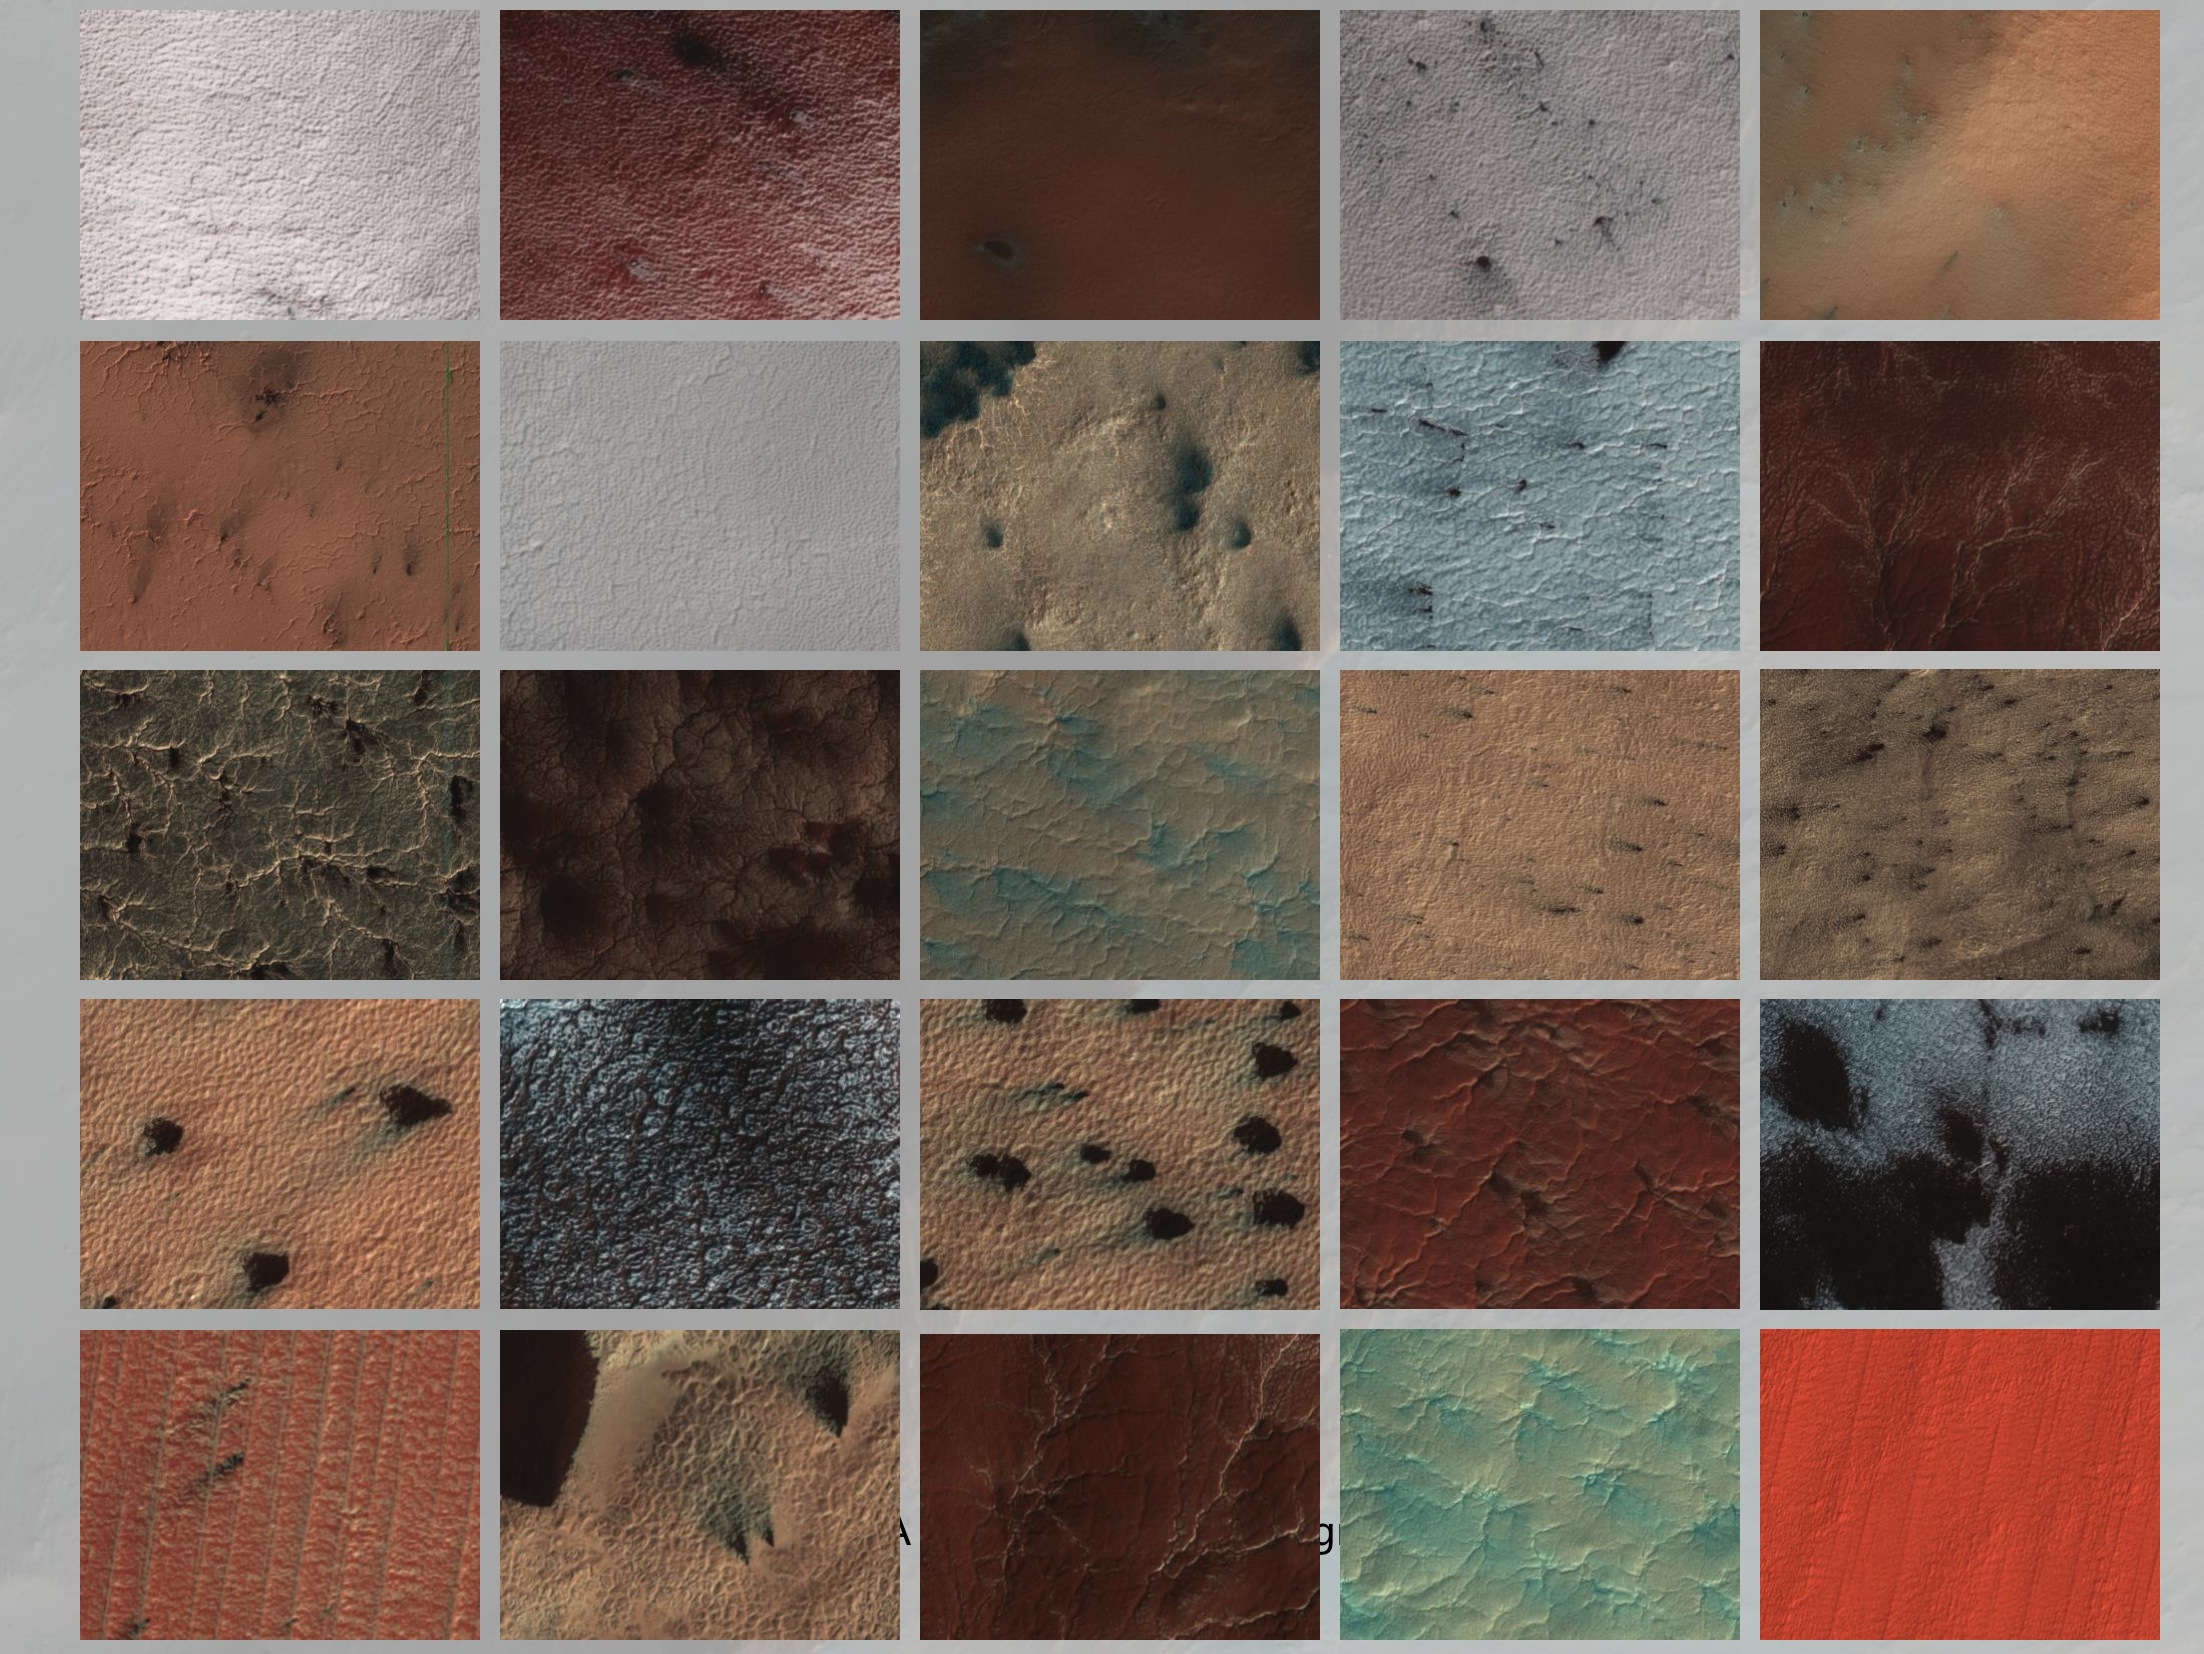 Some examples of cutouts on Planet Four.
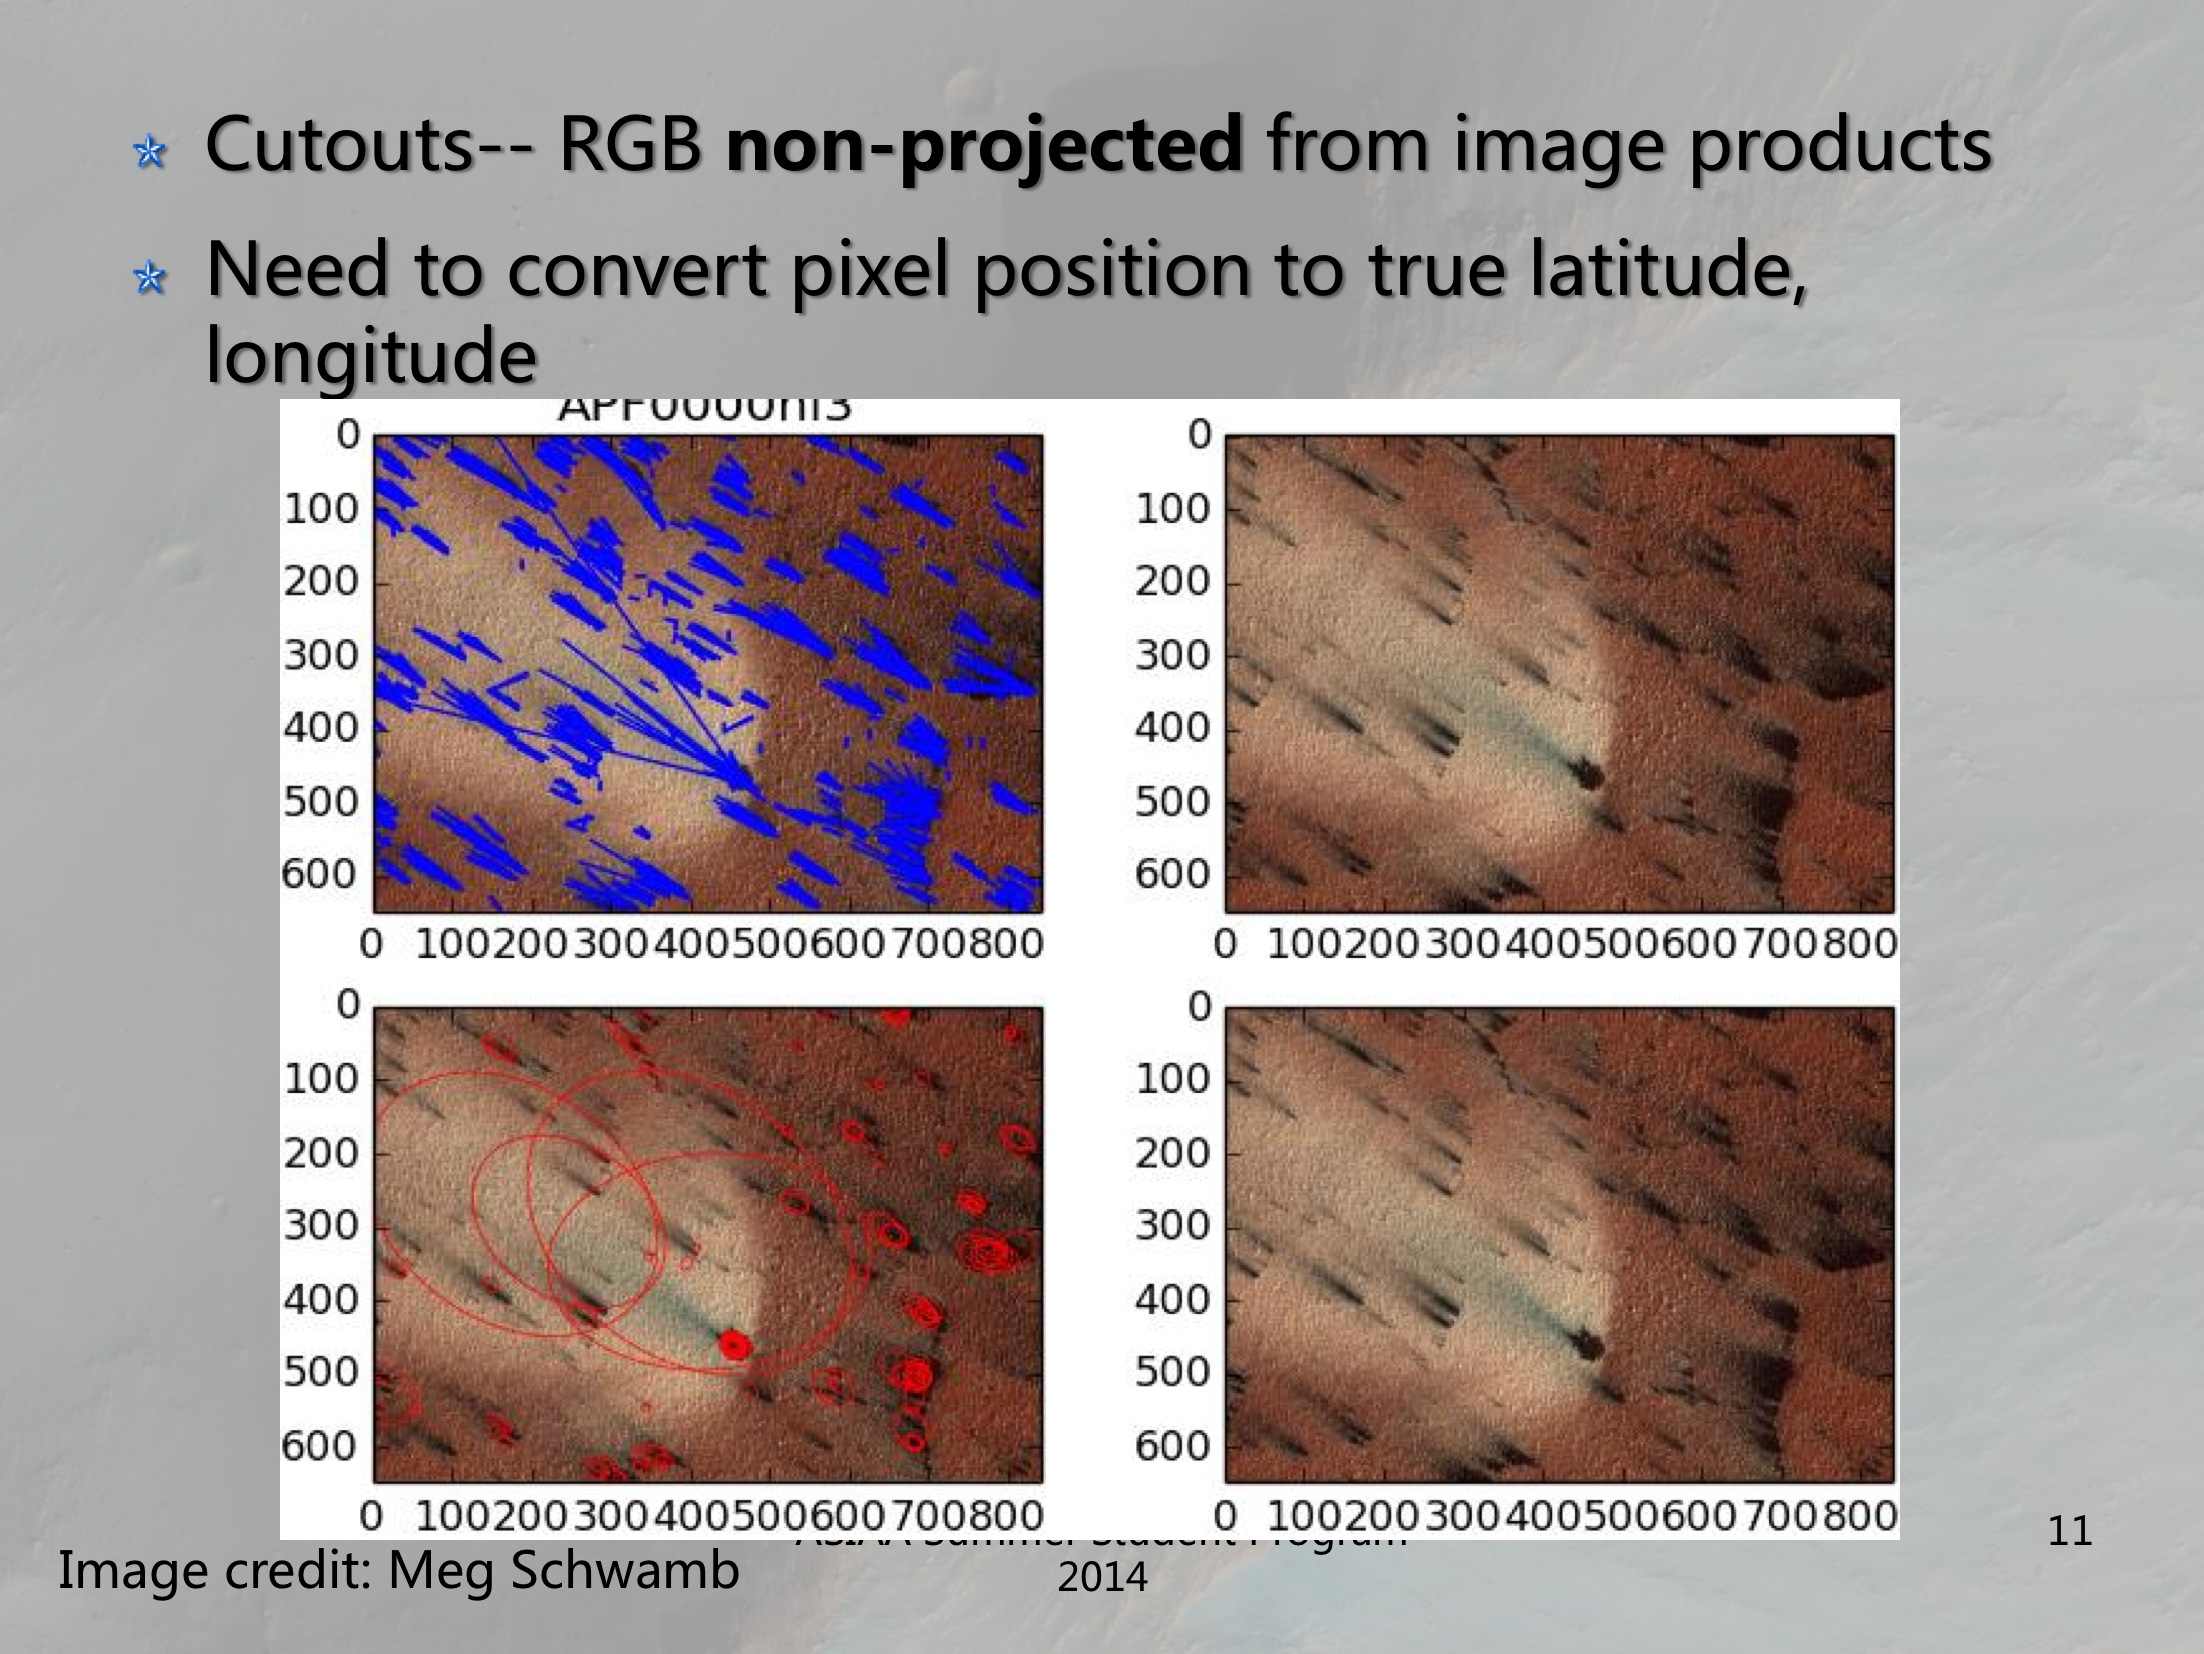 The cutouts are made from RGB, non-projected HiRISE products. Most people are able to make reasonable markings, and the clusters of people’s markings are recorded as pixel position. So we need to convert pixel position to latitude & longitude
. 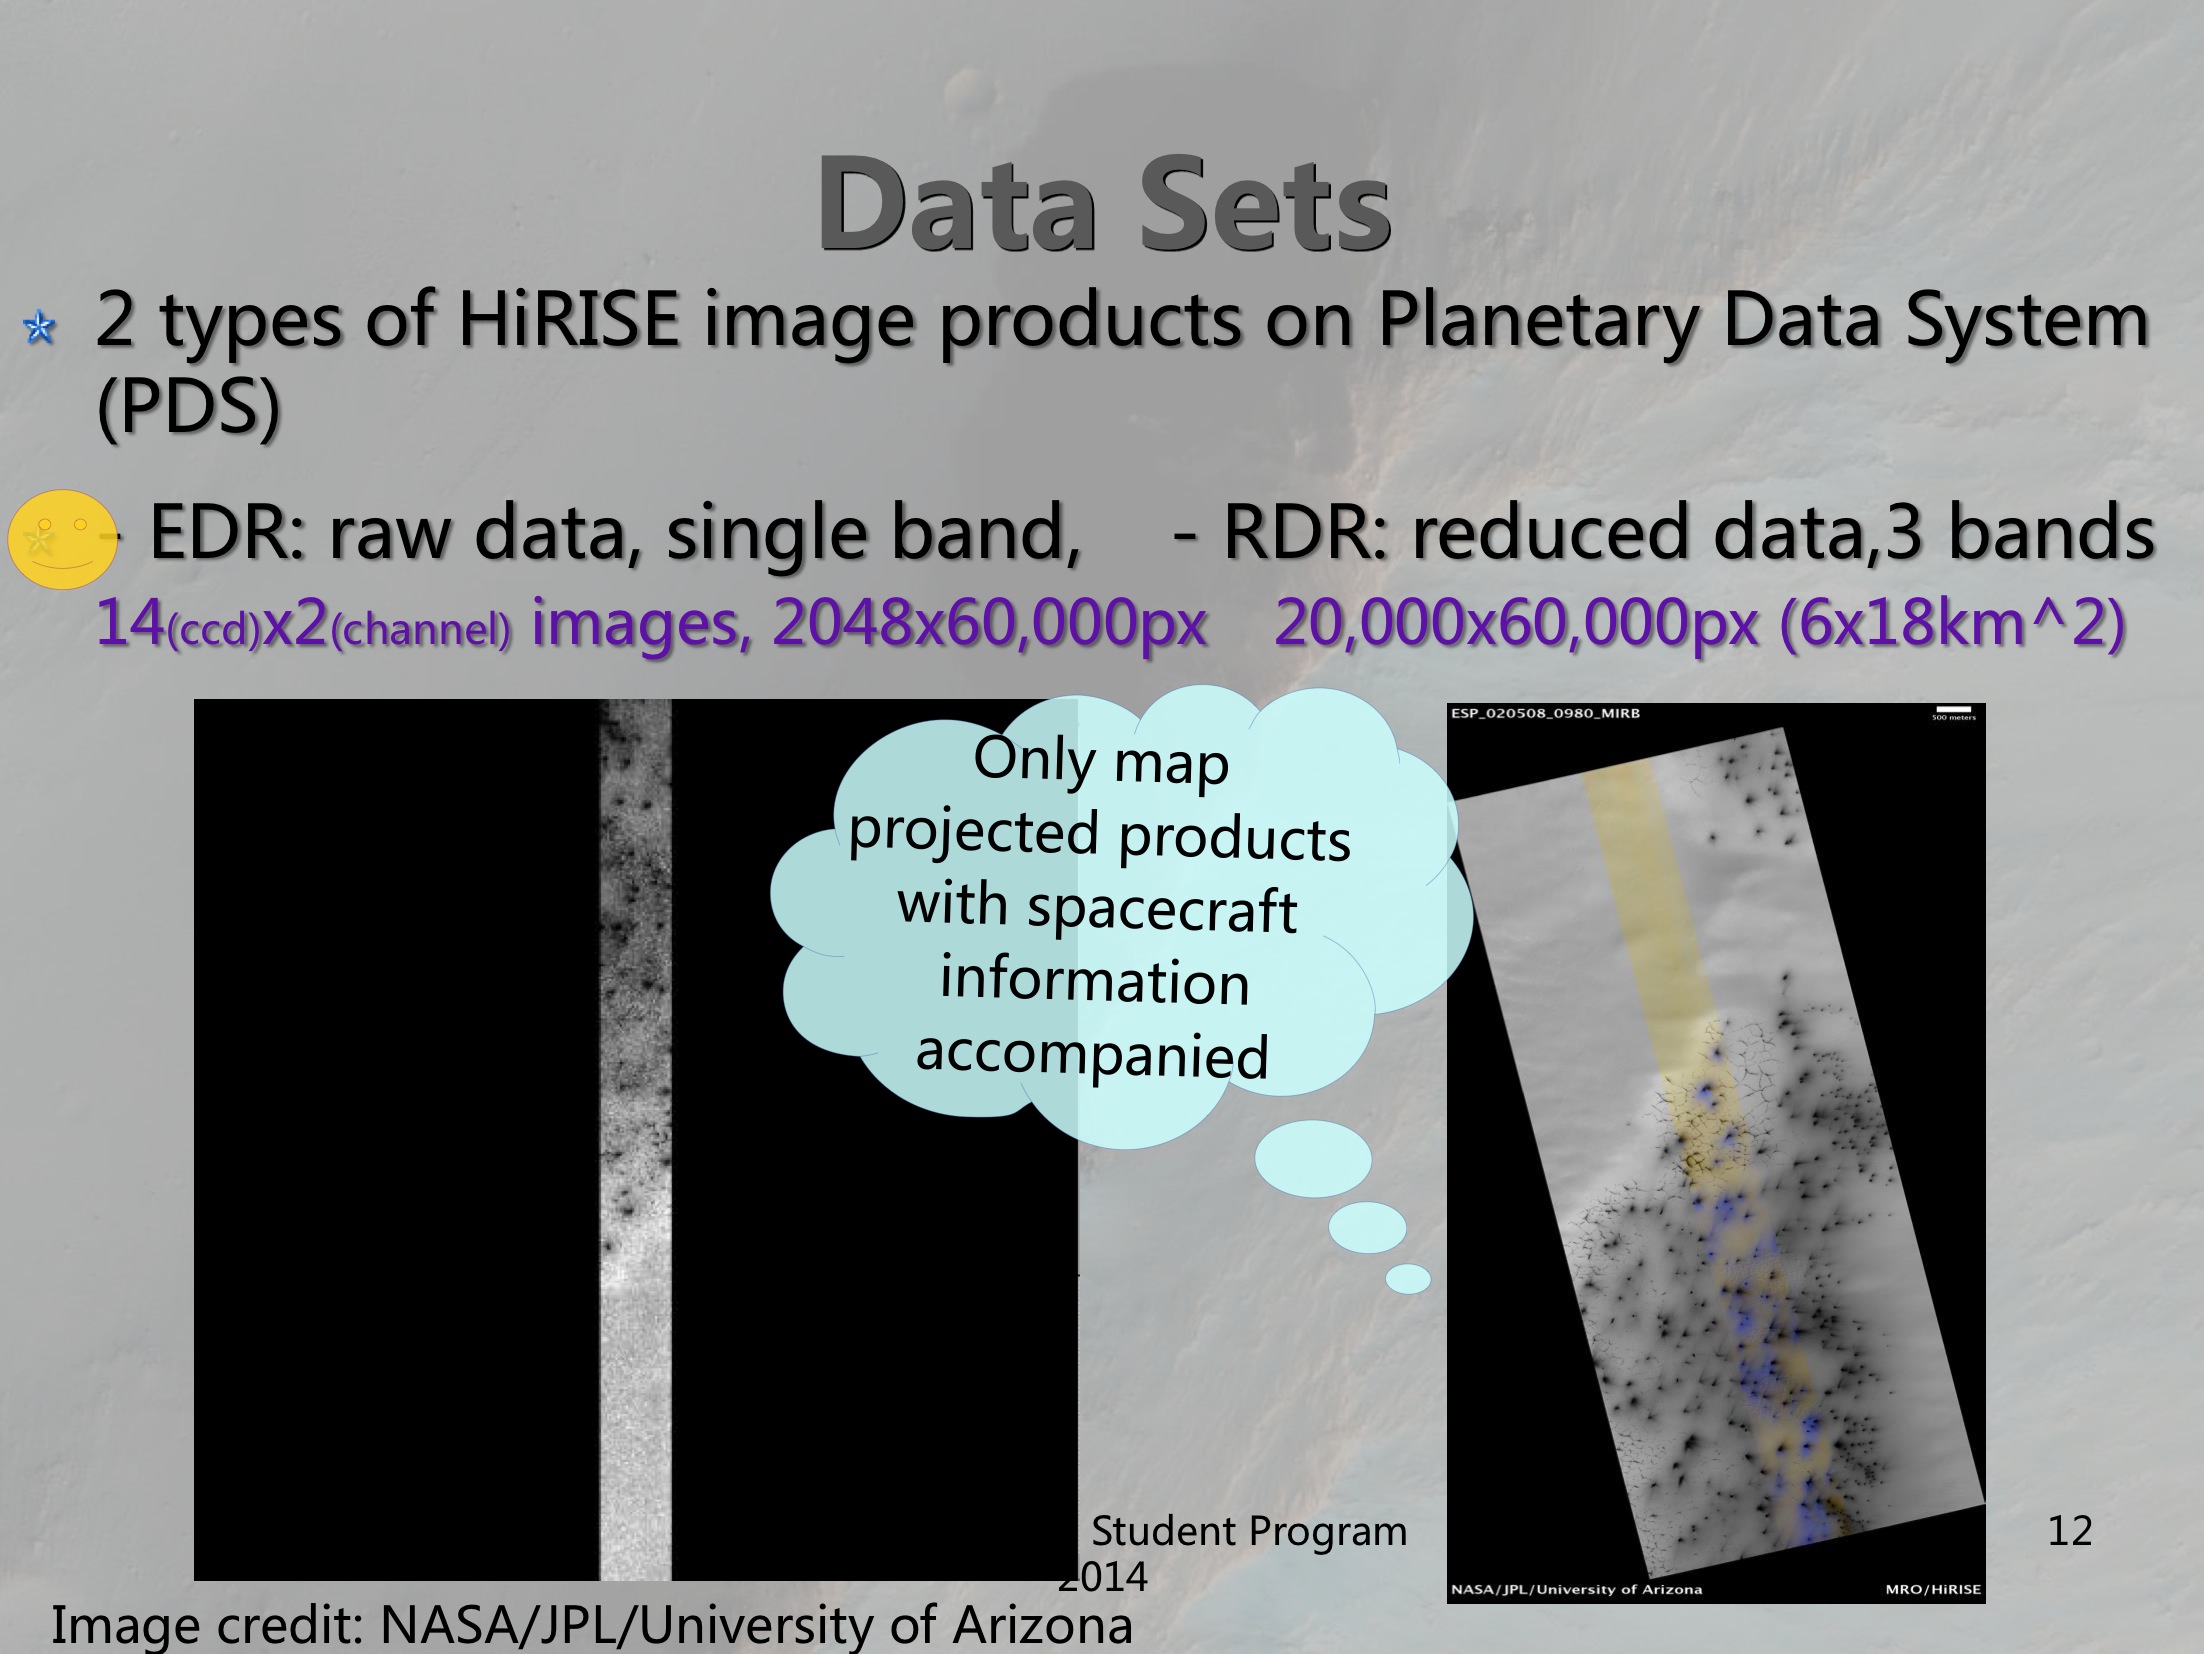 We have 2 types of data but we only use the raw data (EDR). Only map projected products of Reduced data (RDR) have spacecraft information with them. As we actually need position information of non-projected products (they are where the Planet Four cutouts come from), we decided to reassemble mosaics using raw data.
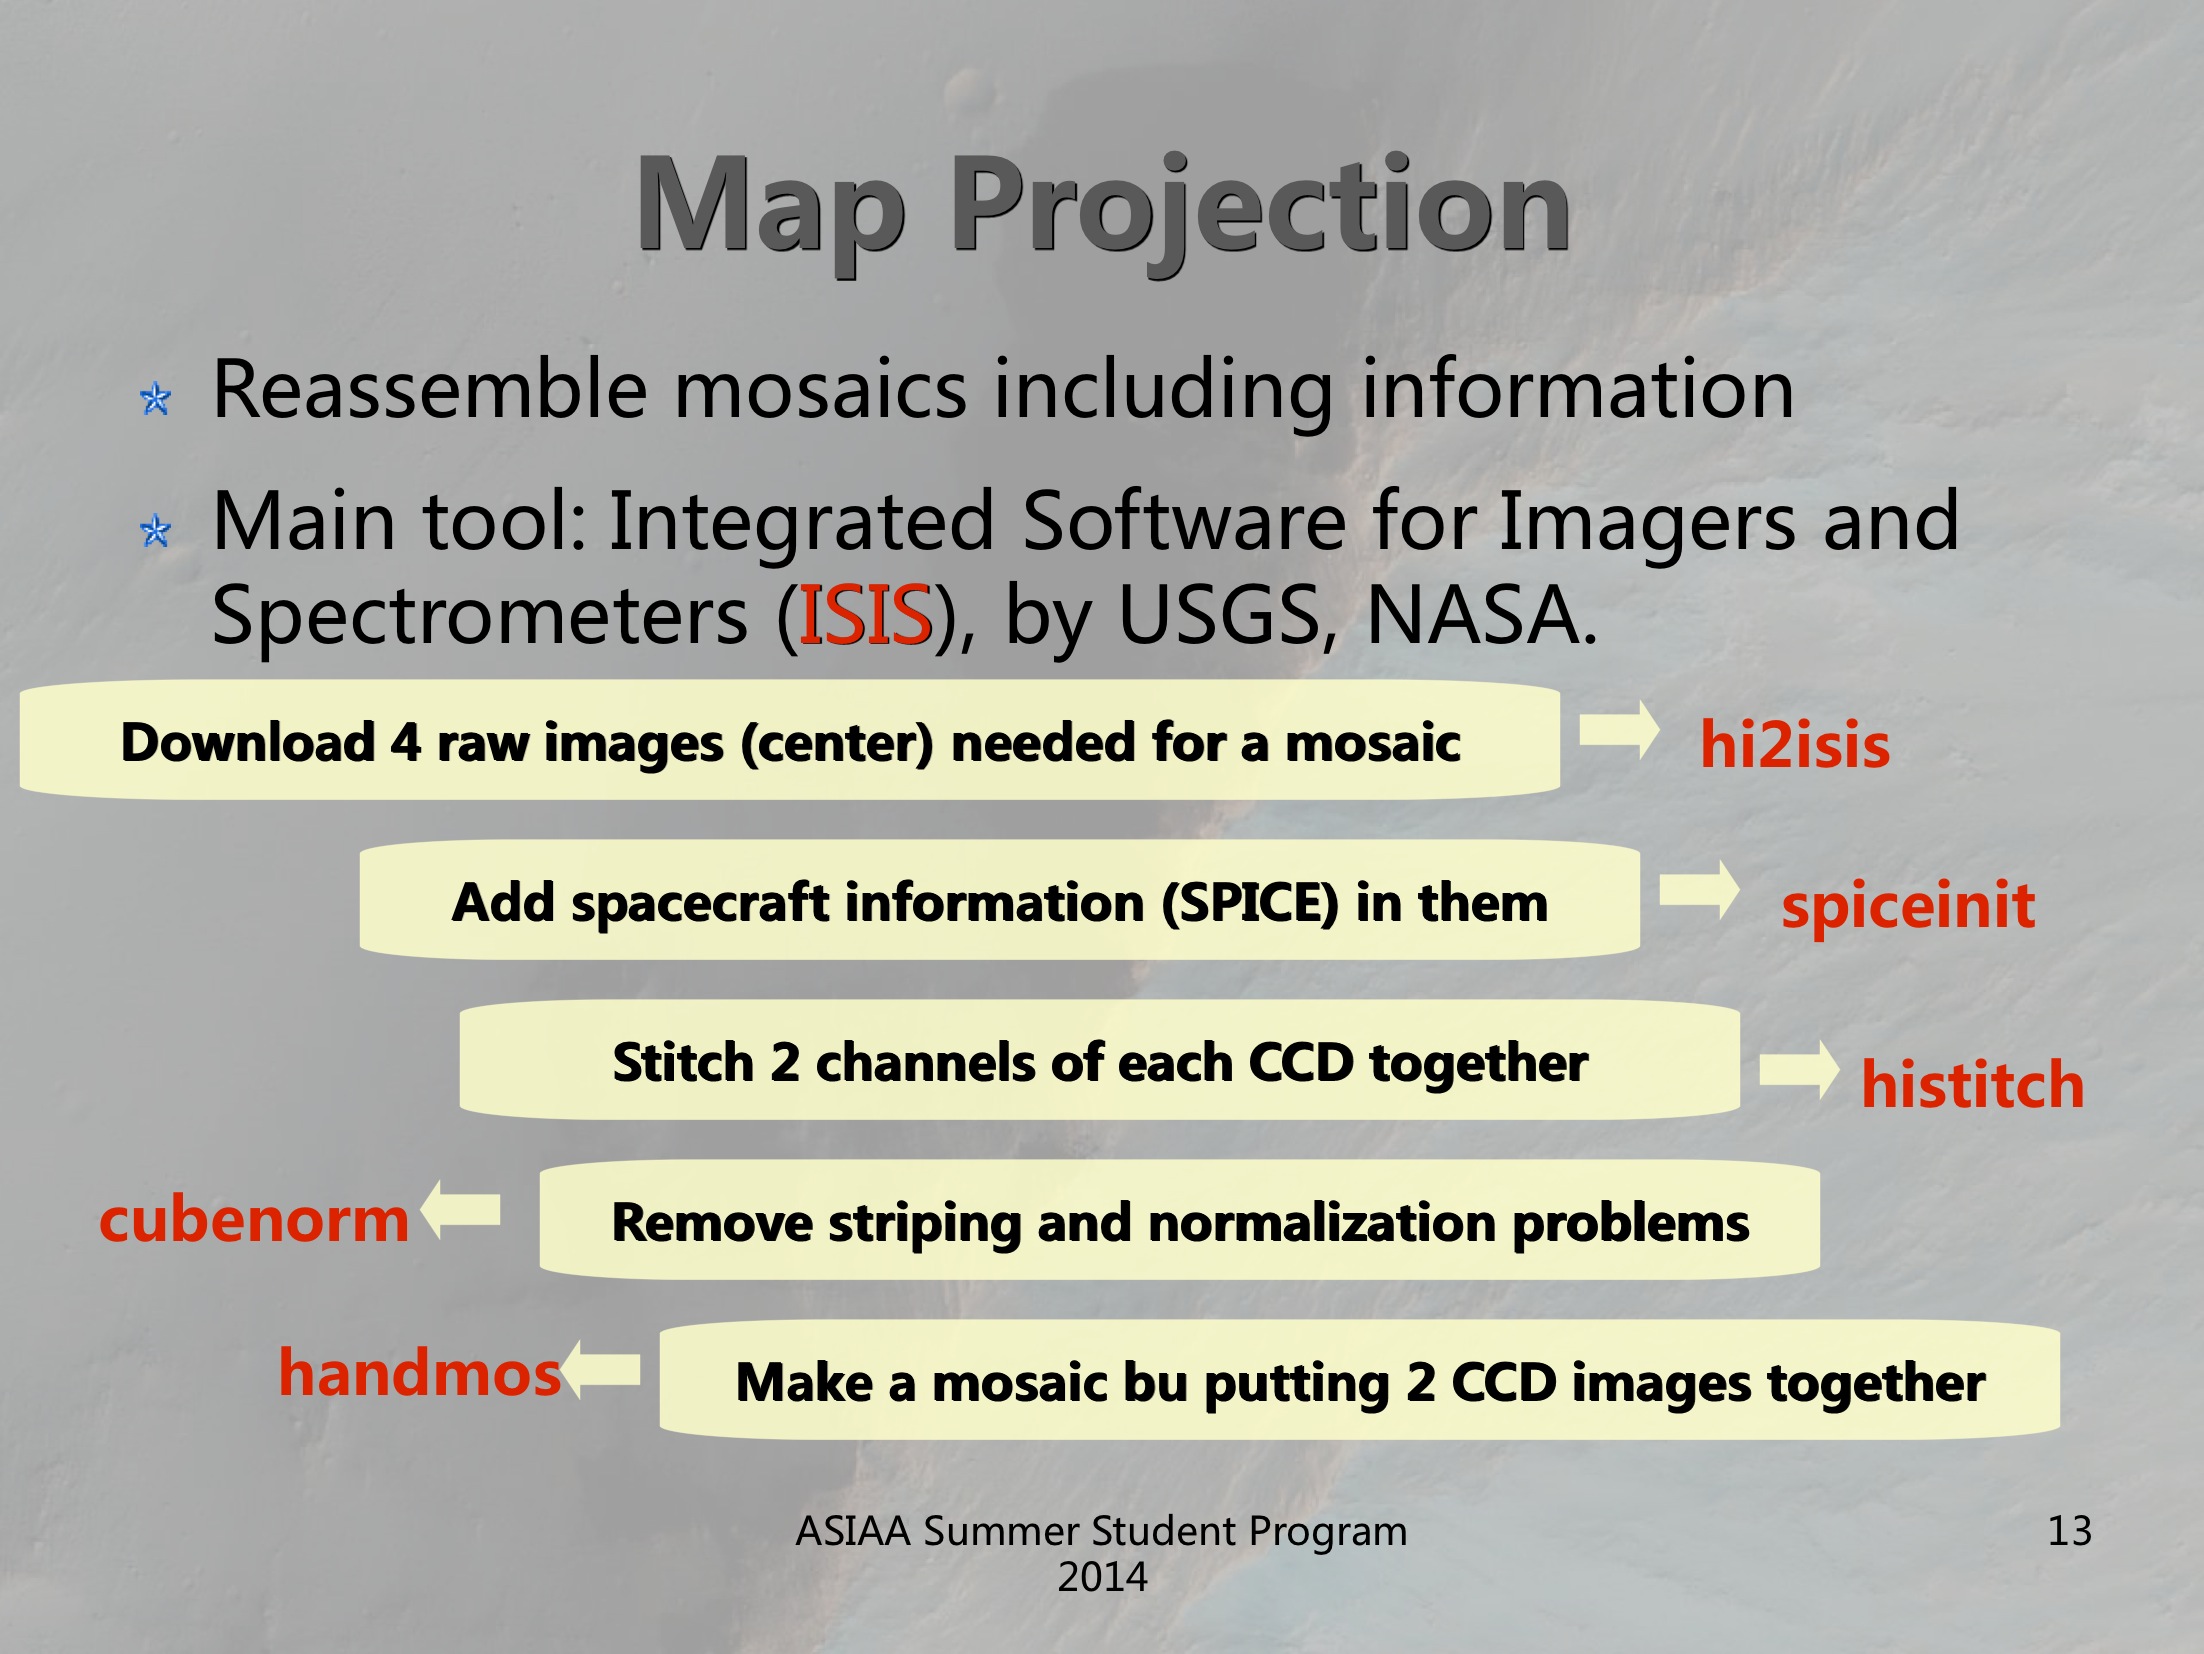
The tool we used, ISIS, is a free, specialized, digital image processing software package developed by the USGS for NASA. It is able to process data from NASA and International spacecraft missions including HiRISE. With applications in ISIS, we could follow the whole process presented here.
 The schematic of the reduction process. We developed a pipeline of it.
 Now, we are able to grab position information of any point. By getting the central points of HiRISE images, we have the distribution of them in a polar view. By drawing the images’ outlines, we show the overlap of different HiRISE images, which were taken at different periods. Study on a point in the overlap region will give the time evolution of it.
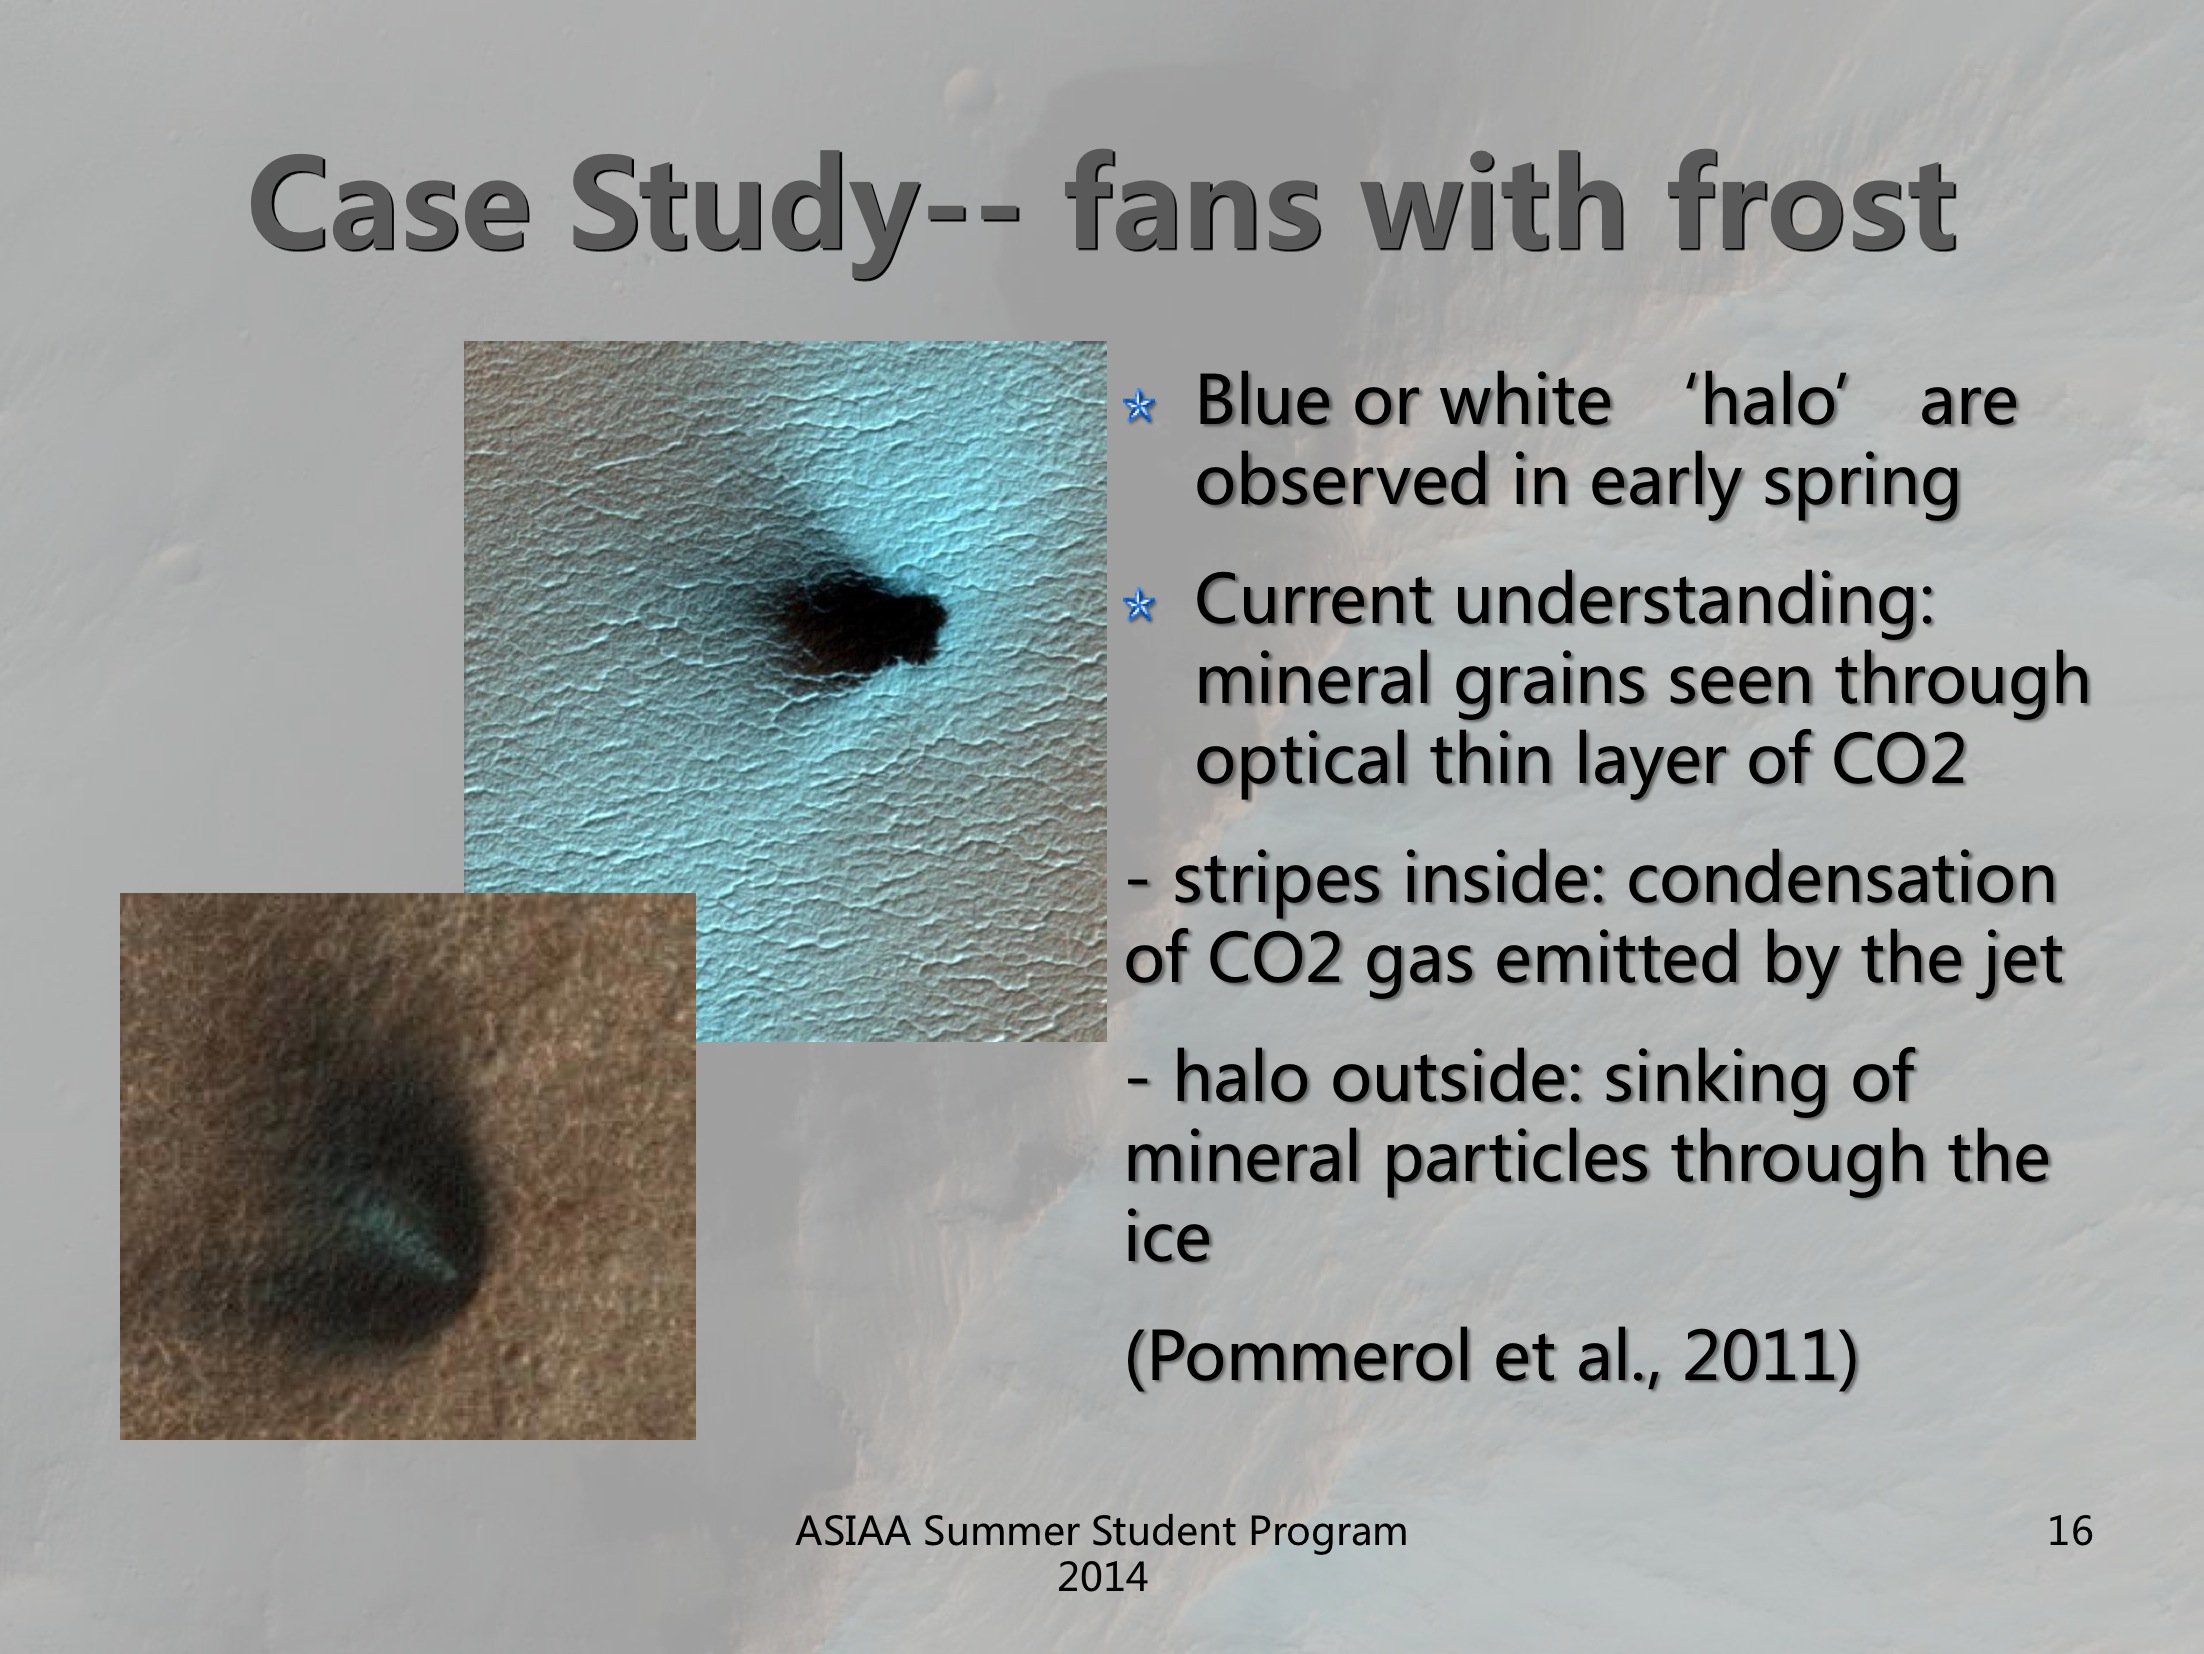 We can use these data to study fans with frost, which are common in early spring. The latest hypothesis is that the blue color is caused by a change in the structure of the ice caused the the fan particles sinking into the ice. Yet there is little evidence of it.
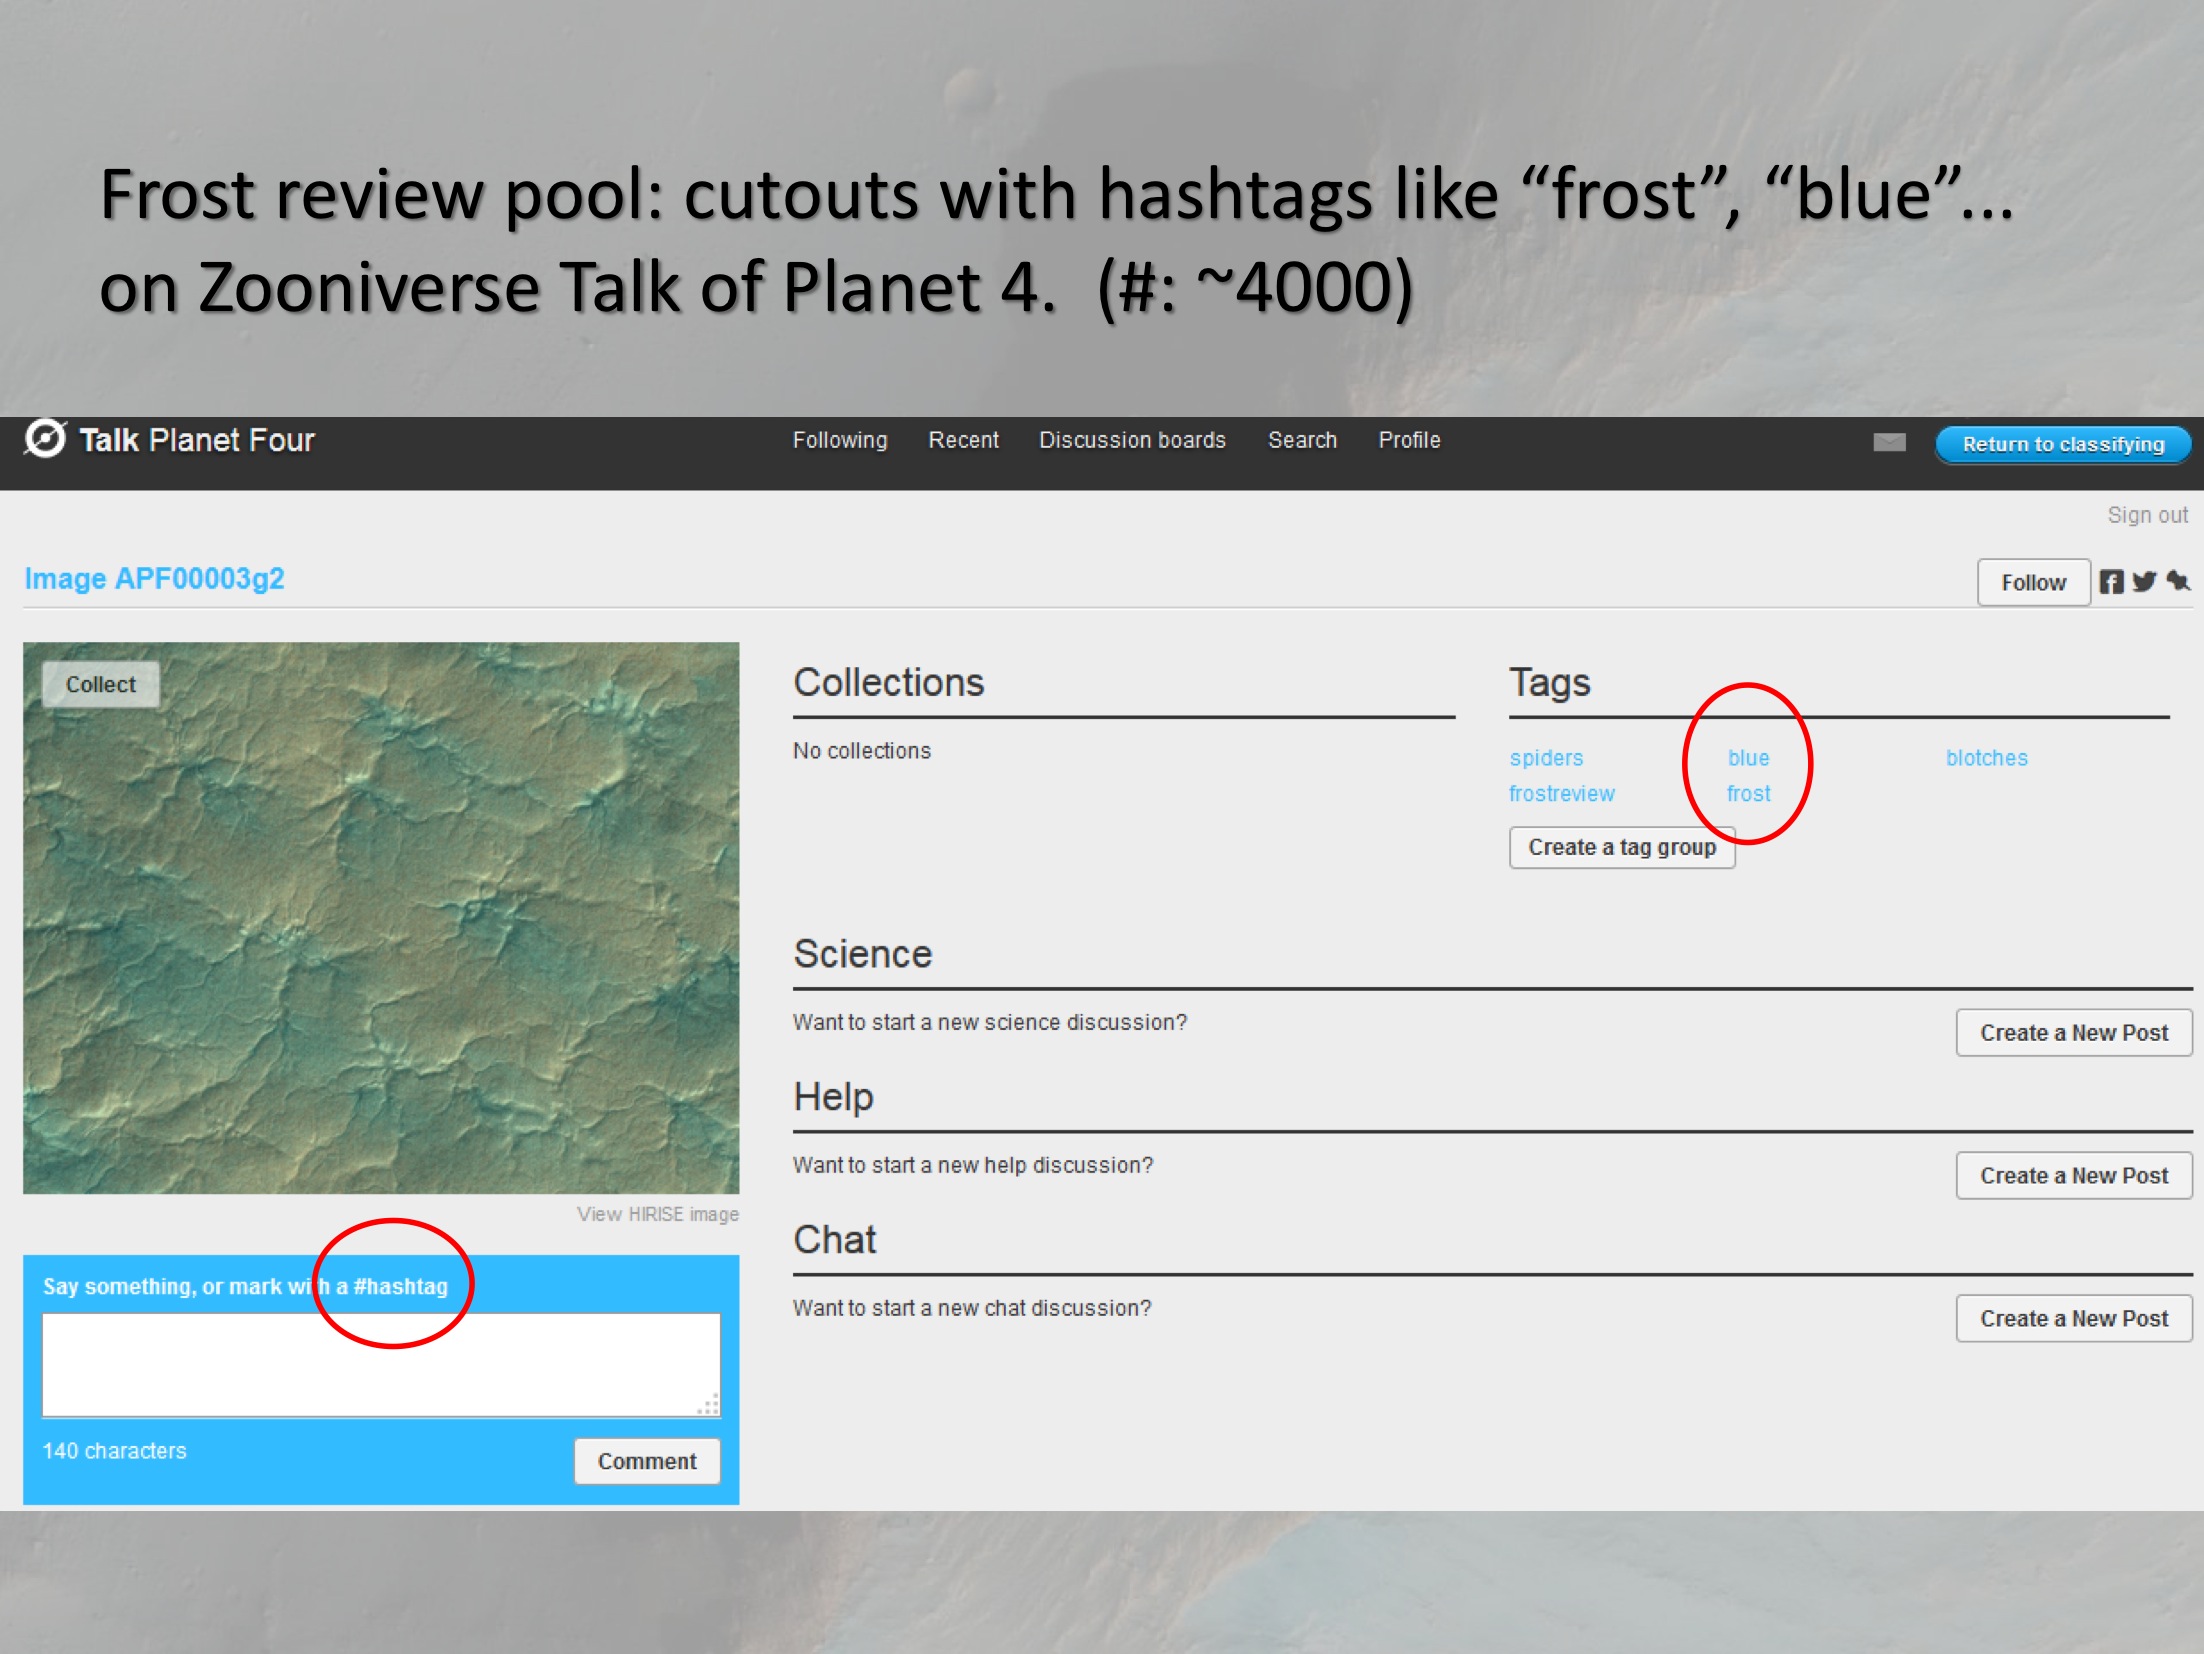 Firstly we need to review certain amount of cutouts with frost in it. The review pool is the cutouts tagged as ‘frost’ or ‘blue’… in Planet Four Talk. Though they are not all the cutouts with frost, but there are still a large amount and might contribute to revealing secrets of frost fans.
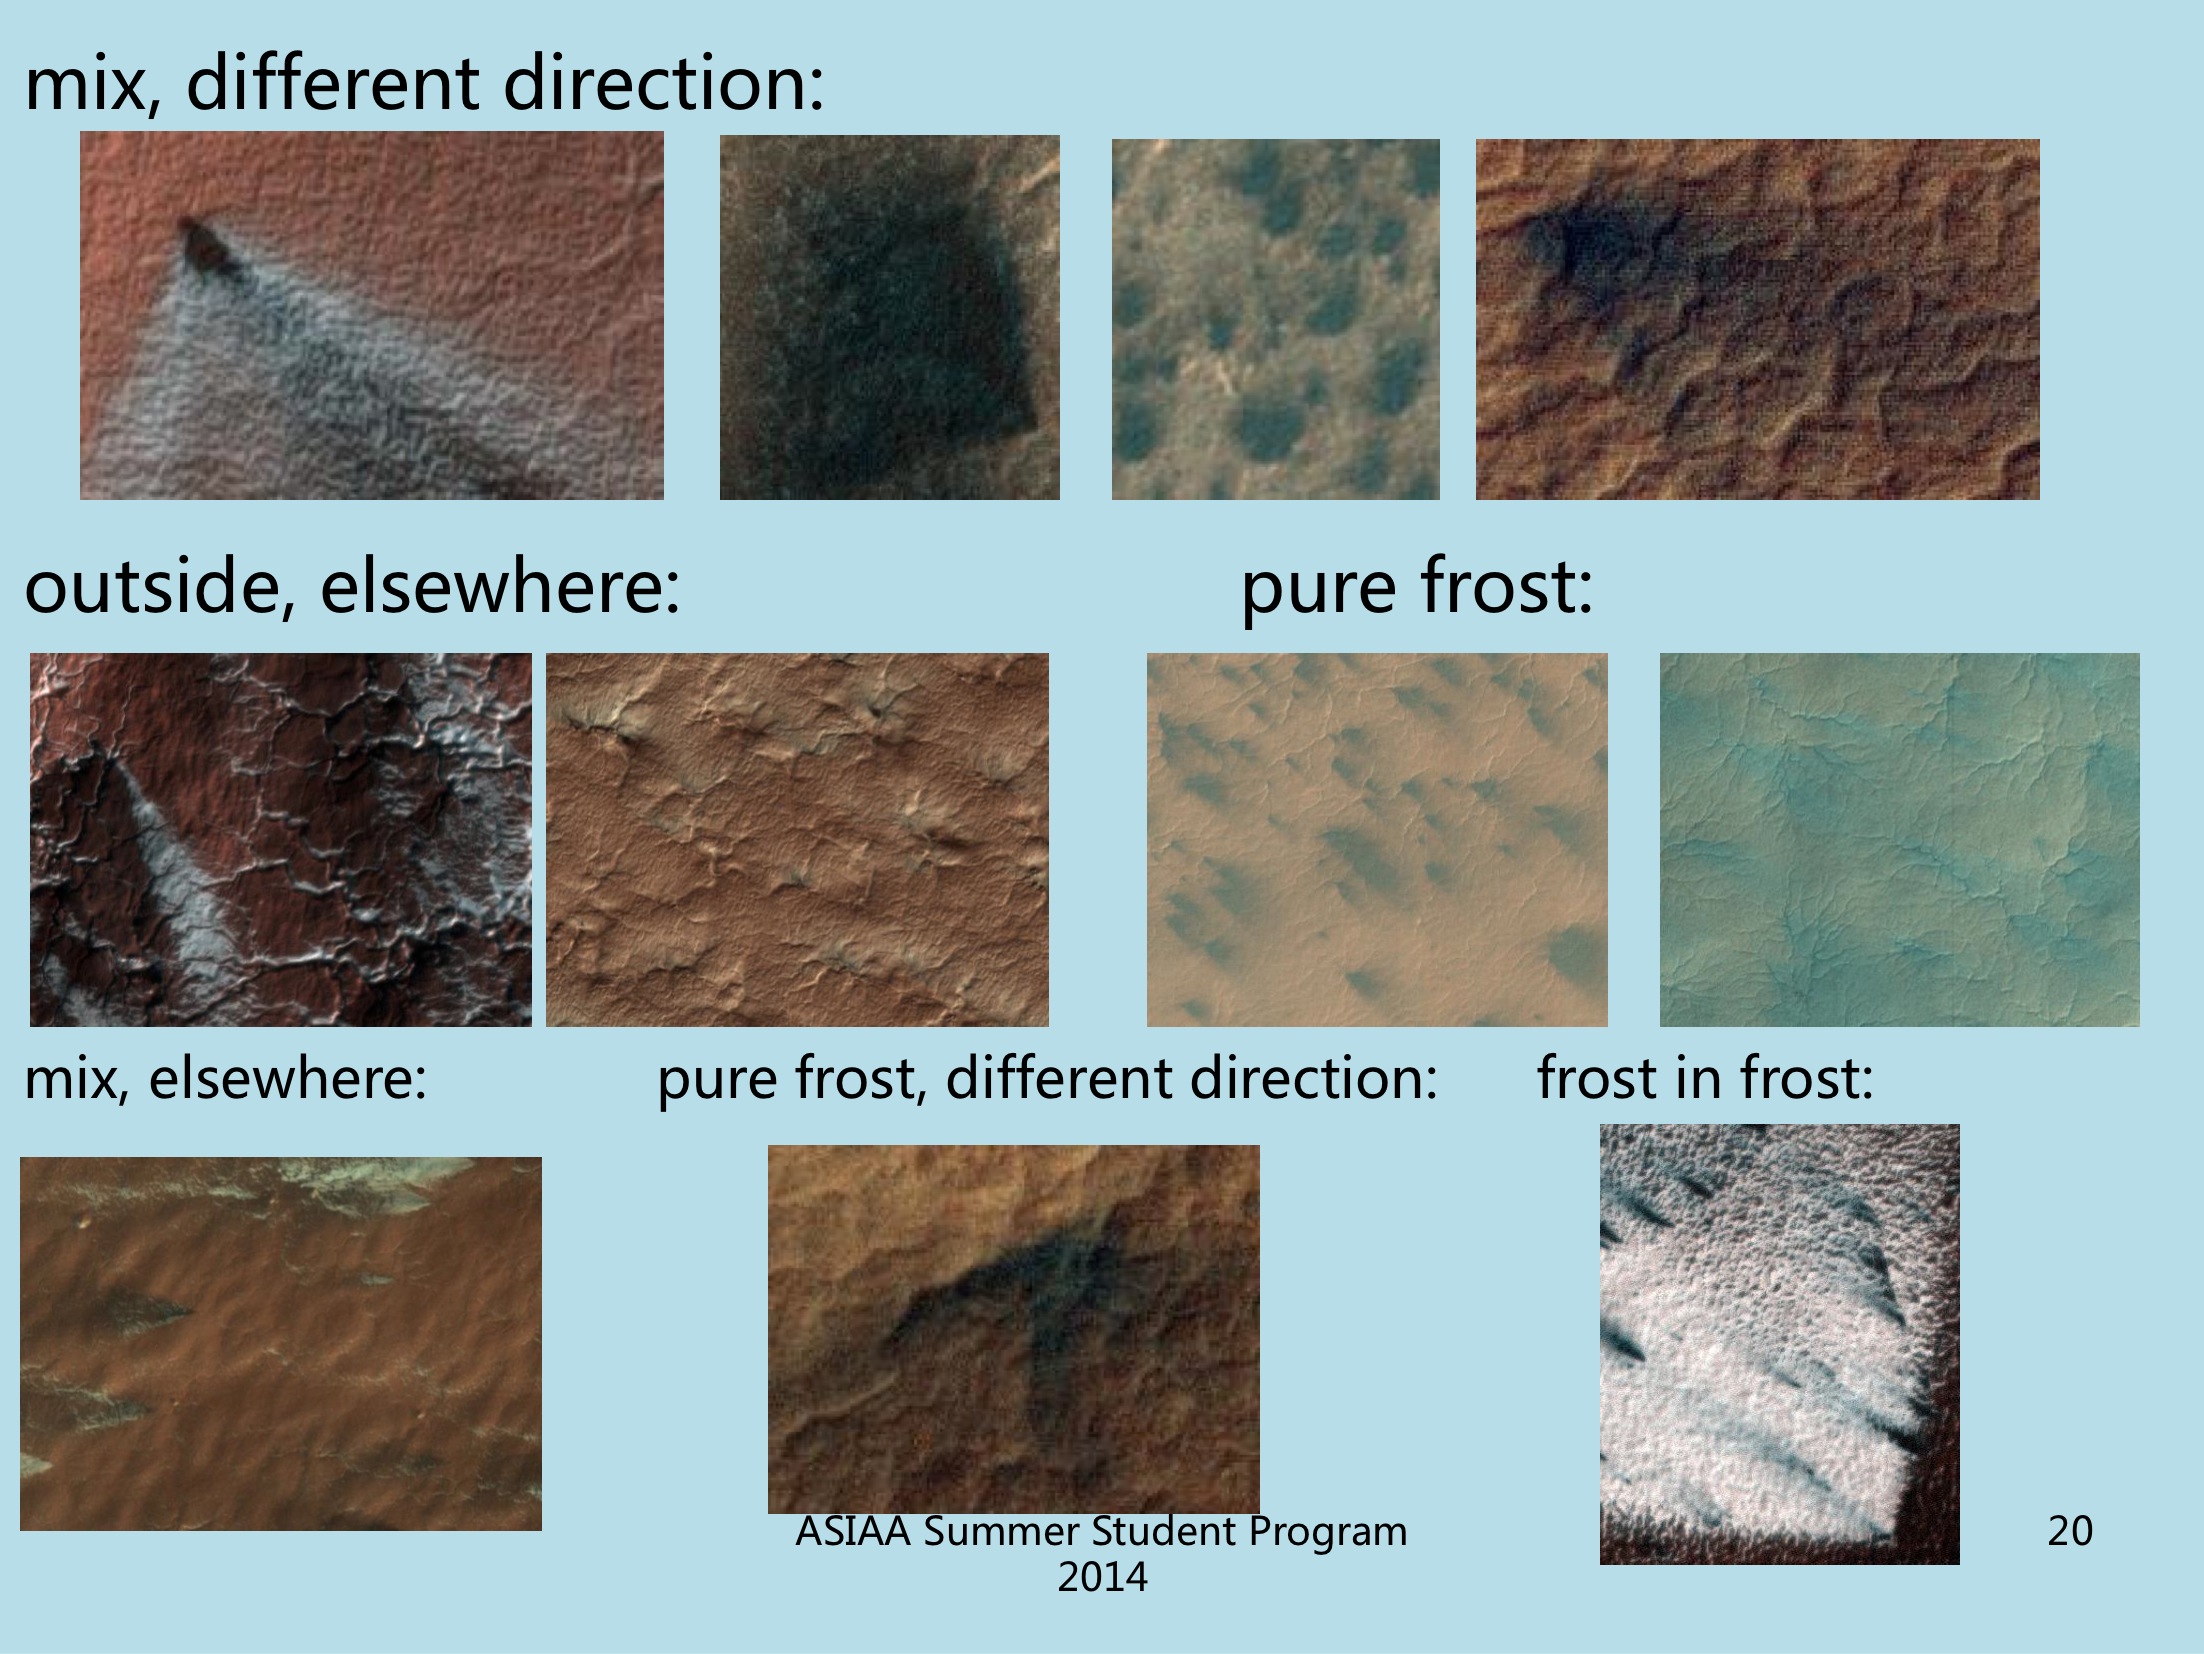
 While reviewing, we classified these frost fans, as shown in slides (18-20)

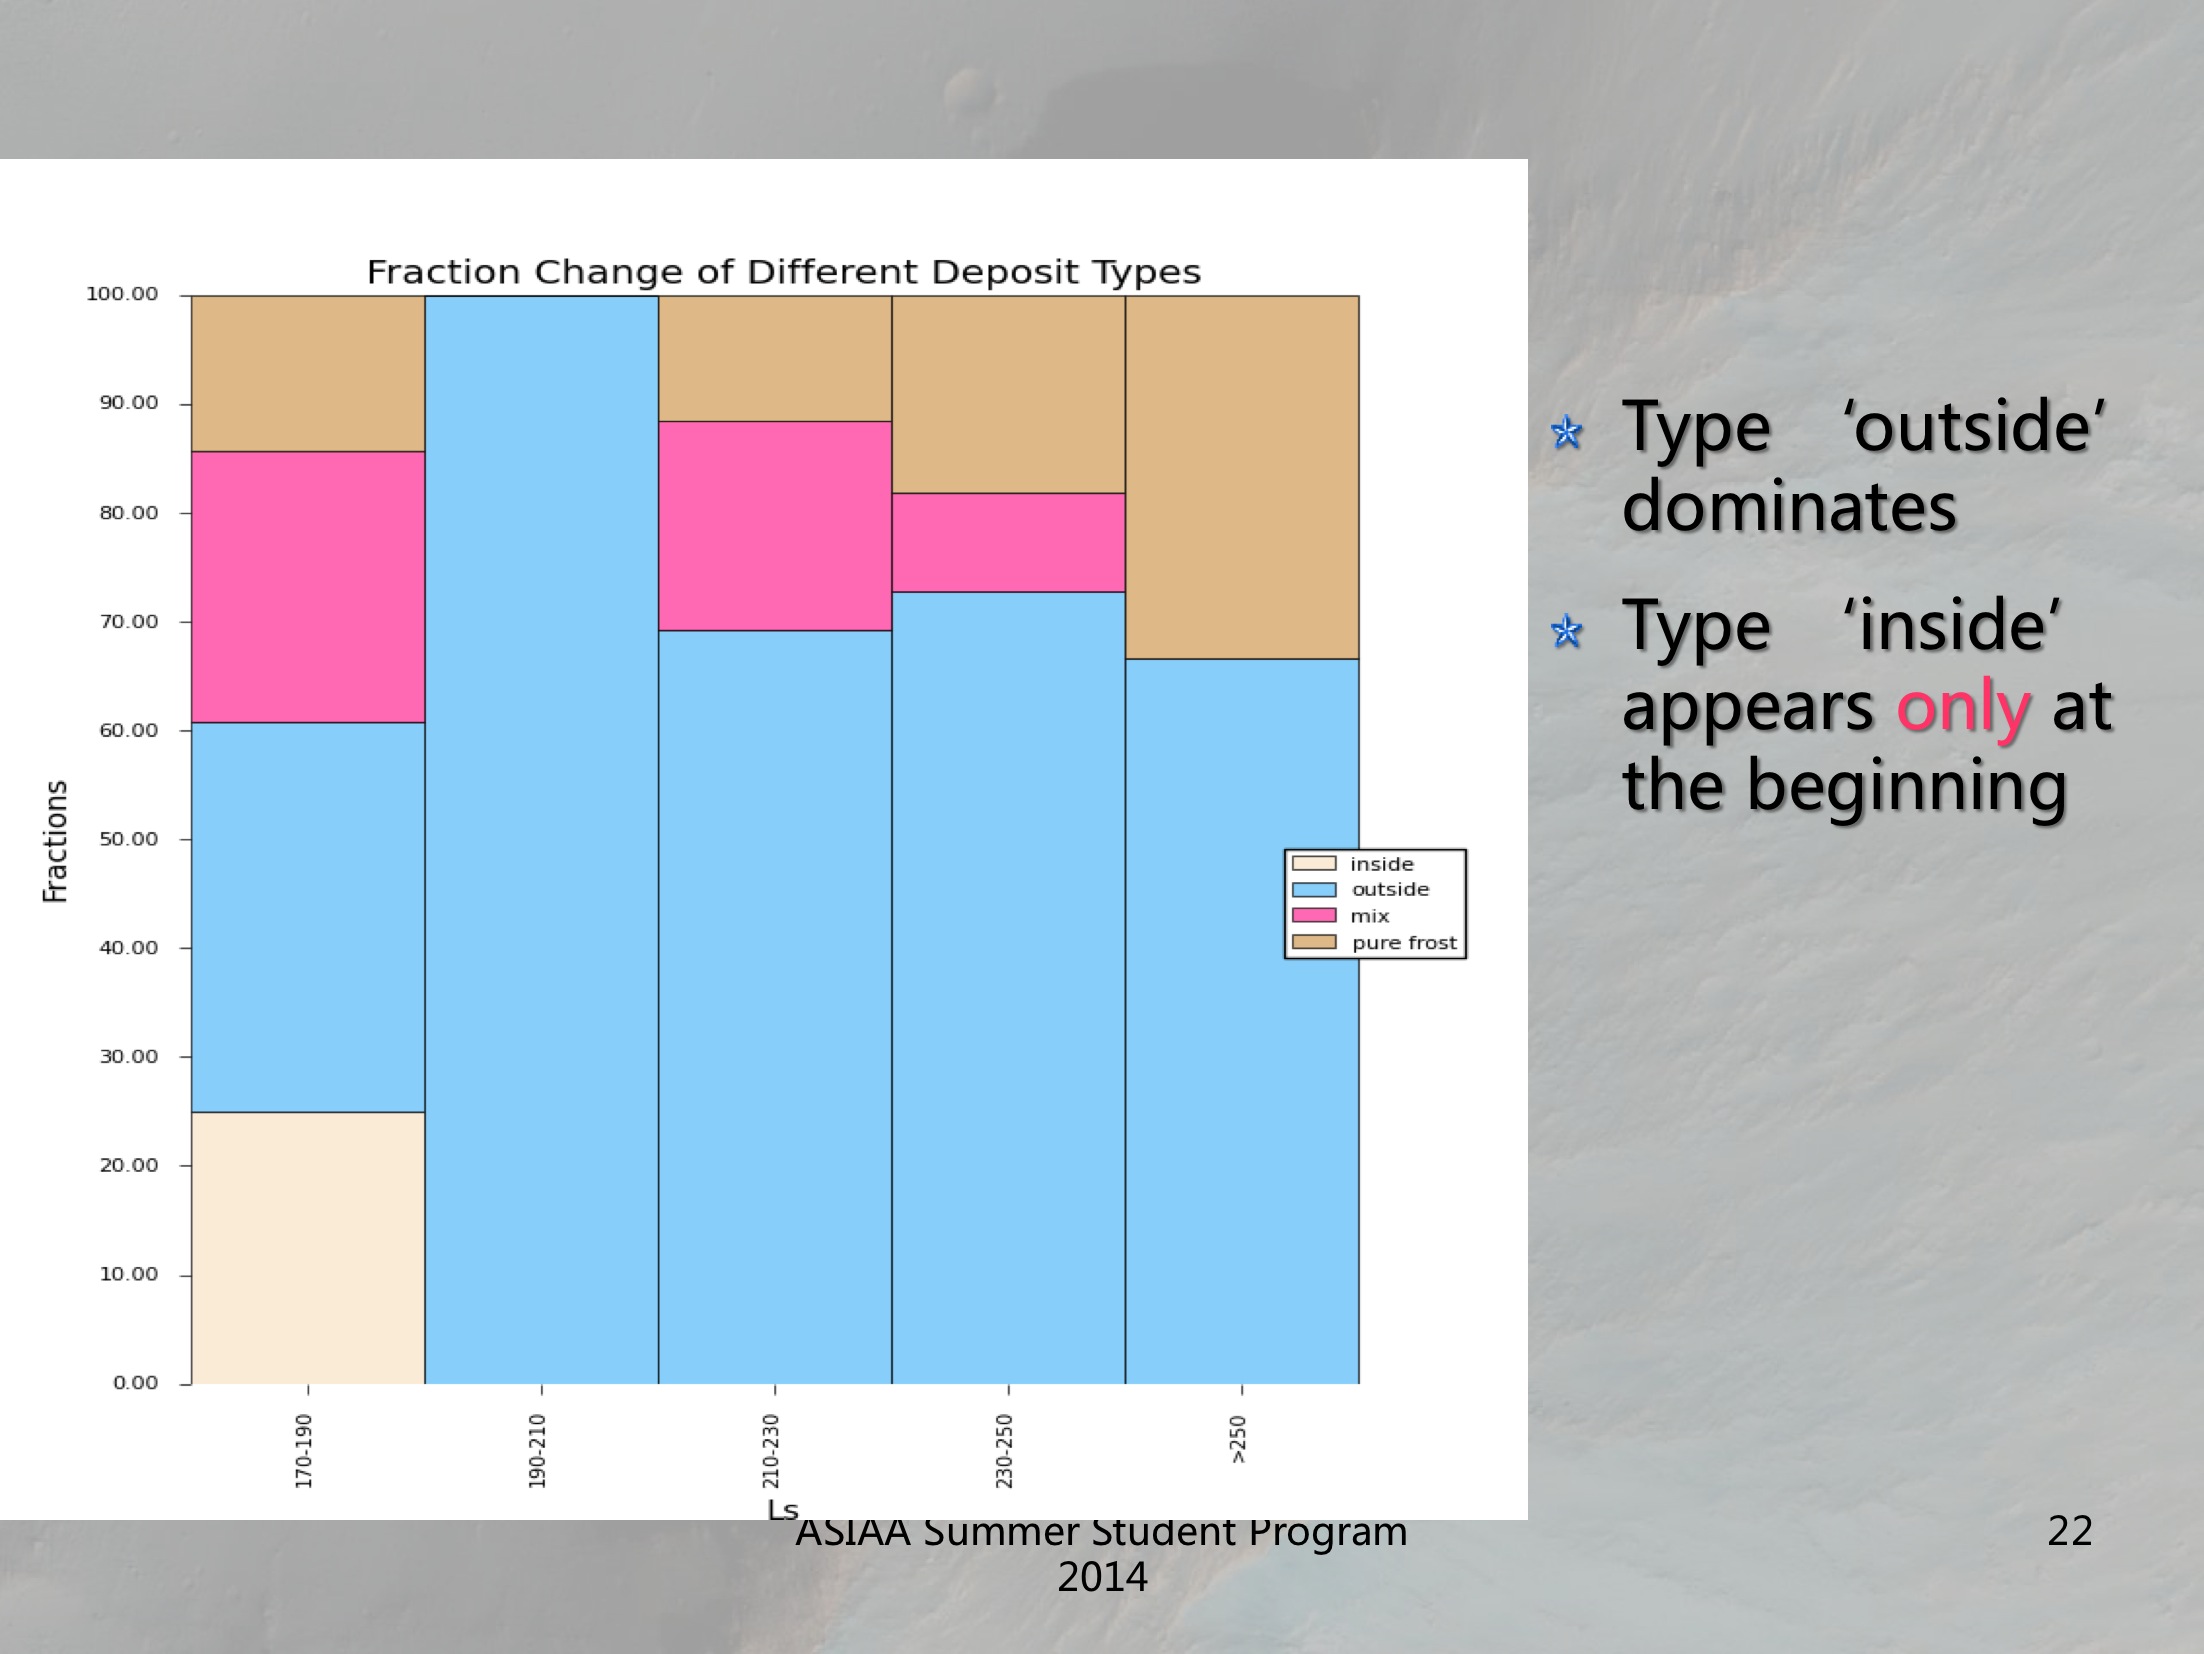
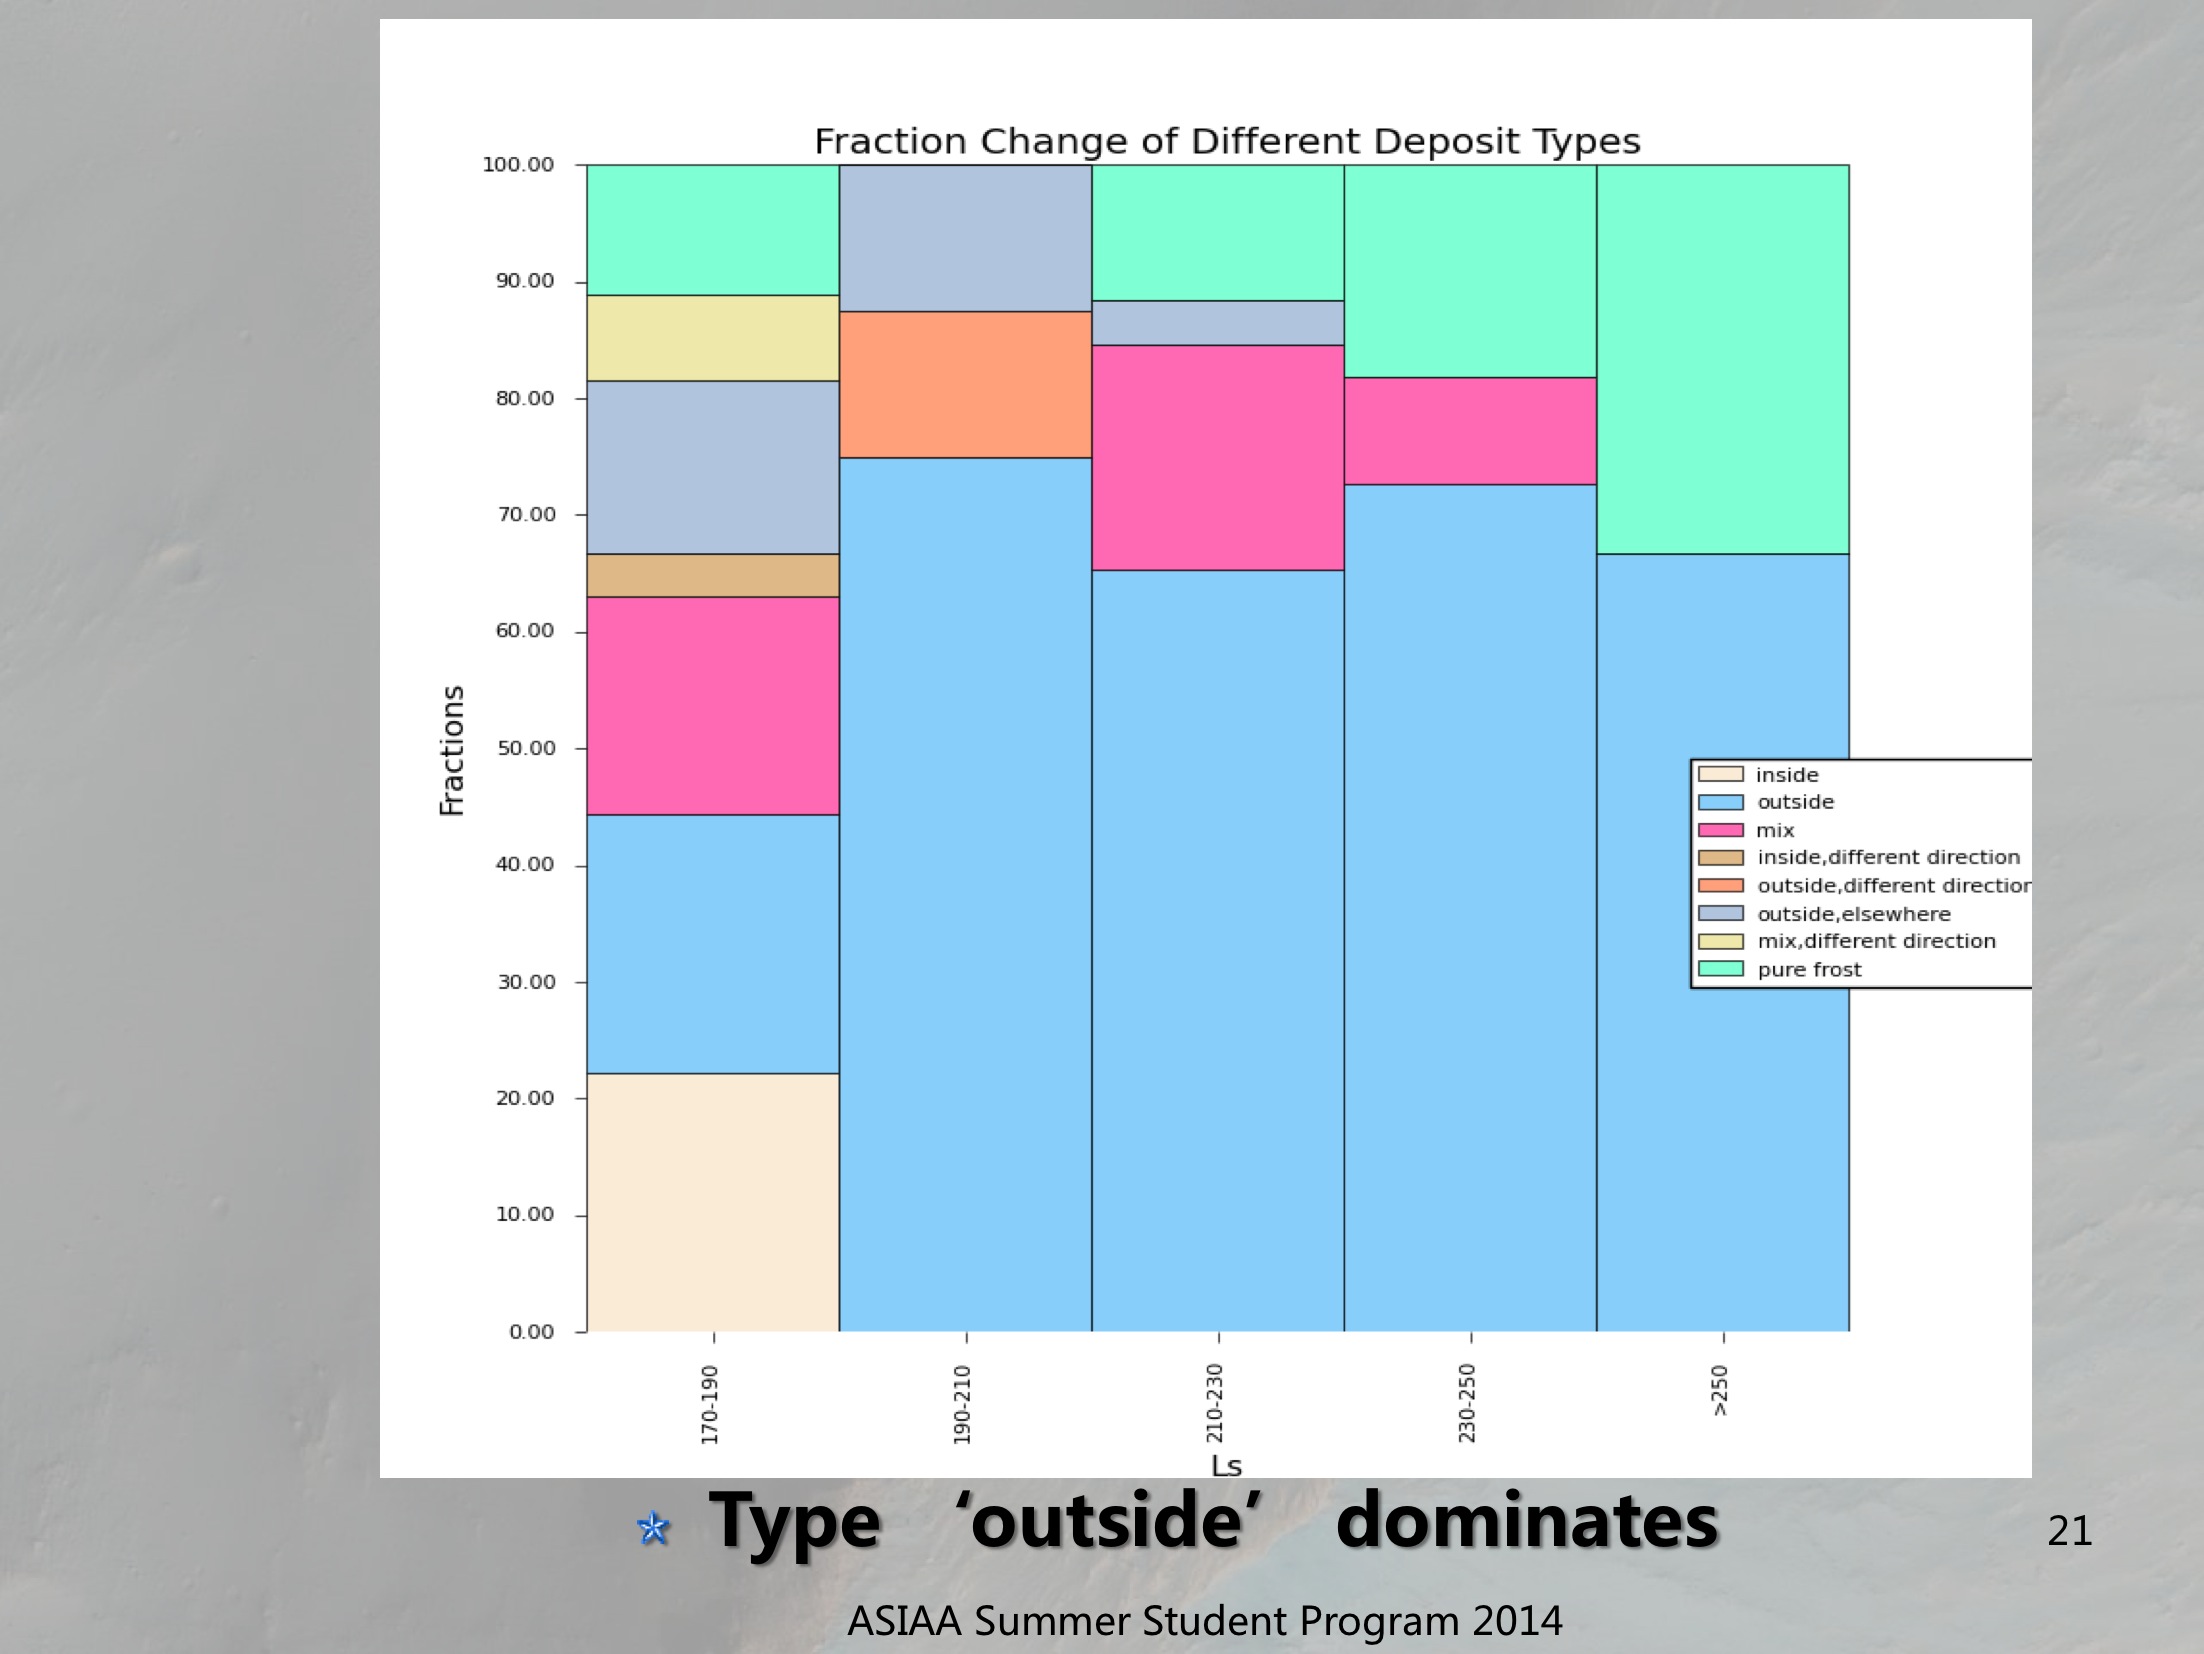 By dividing them into different periods of time, we study how the fraction of each types change over time. It can be seen clearly that type ‘outside’ dominate all the time.
 Next, we combined several types of frost fans together and took a clearer look at how the locations of frost relative to fans change. We found that frosts only appear very early and then nearly all of them become outside of fans later.
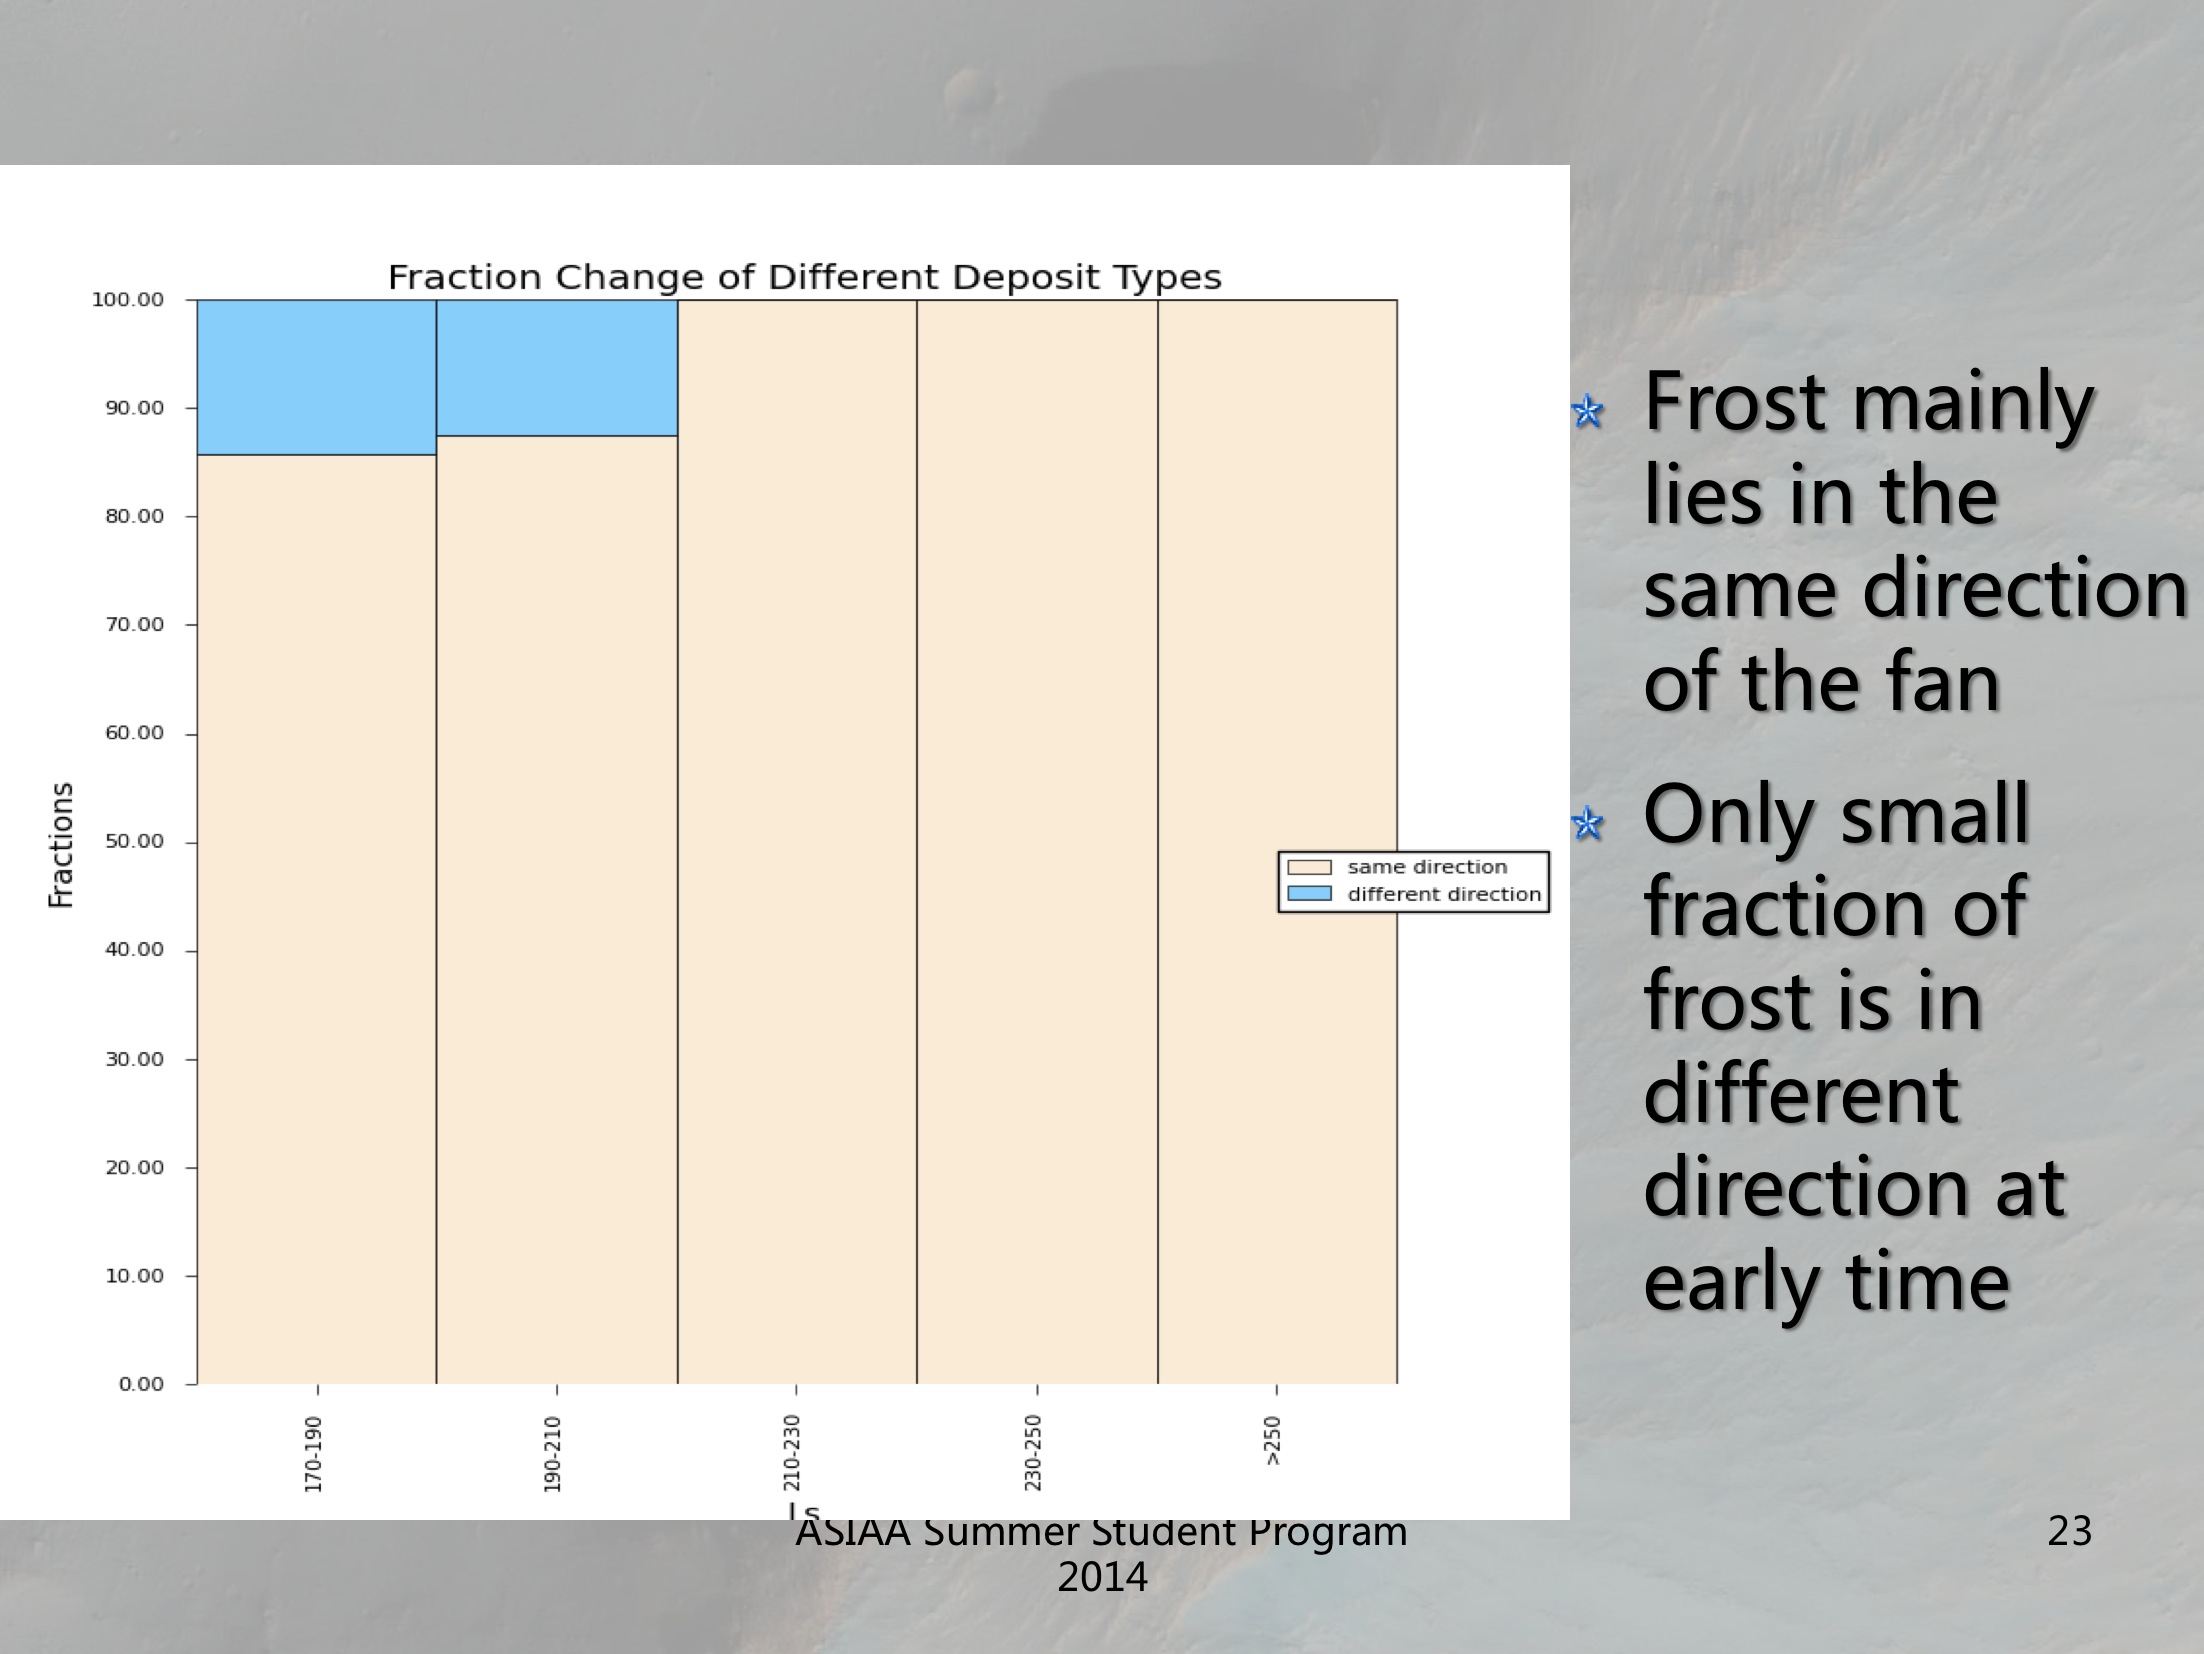 Another combining shows that frosts mainly lie in the same direction of fans, some in different directions appear early at the beginning.
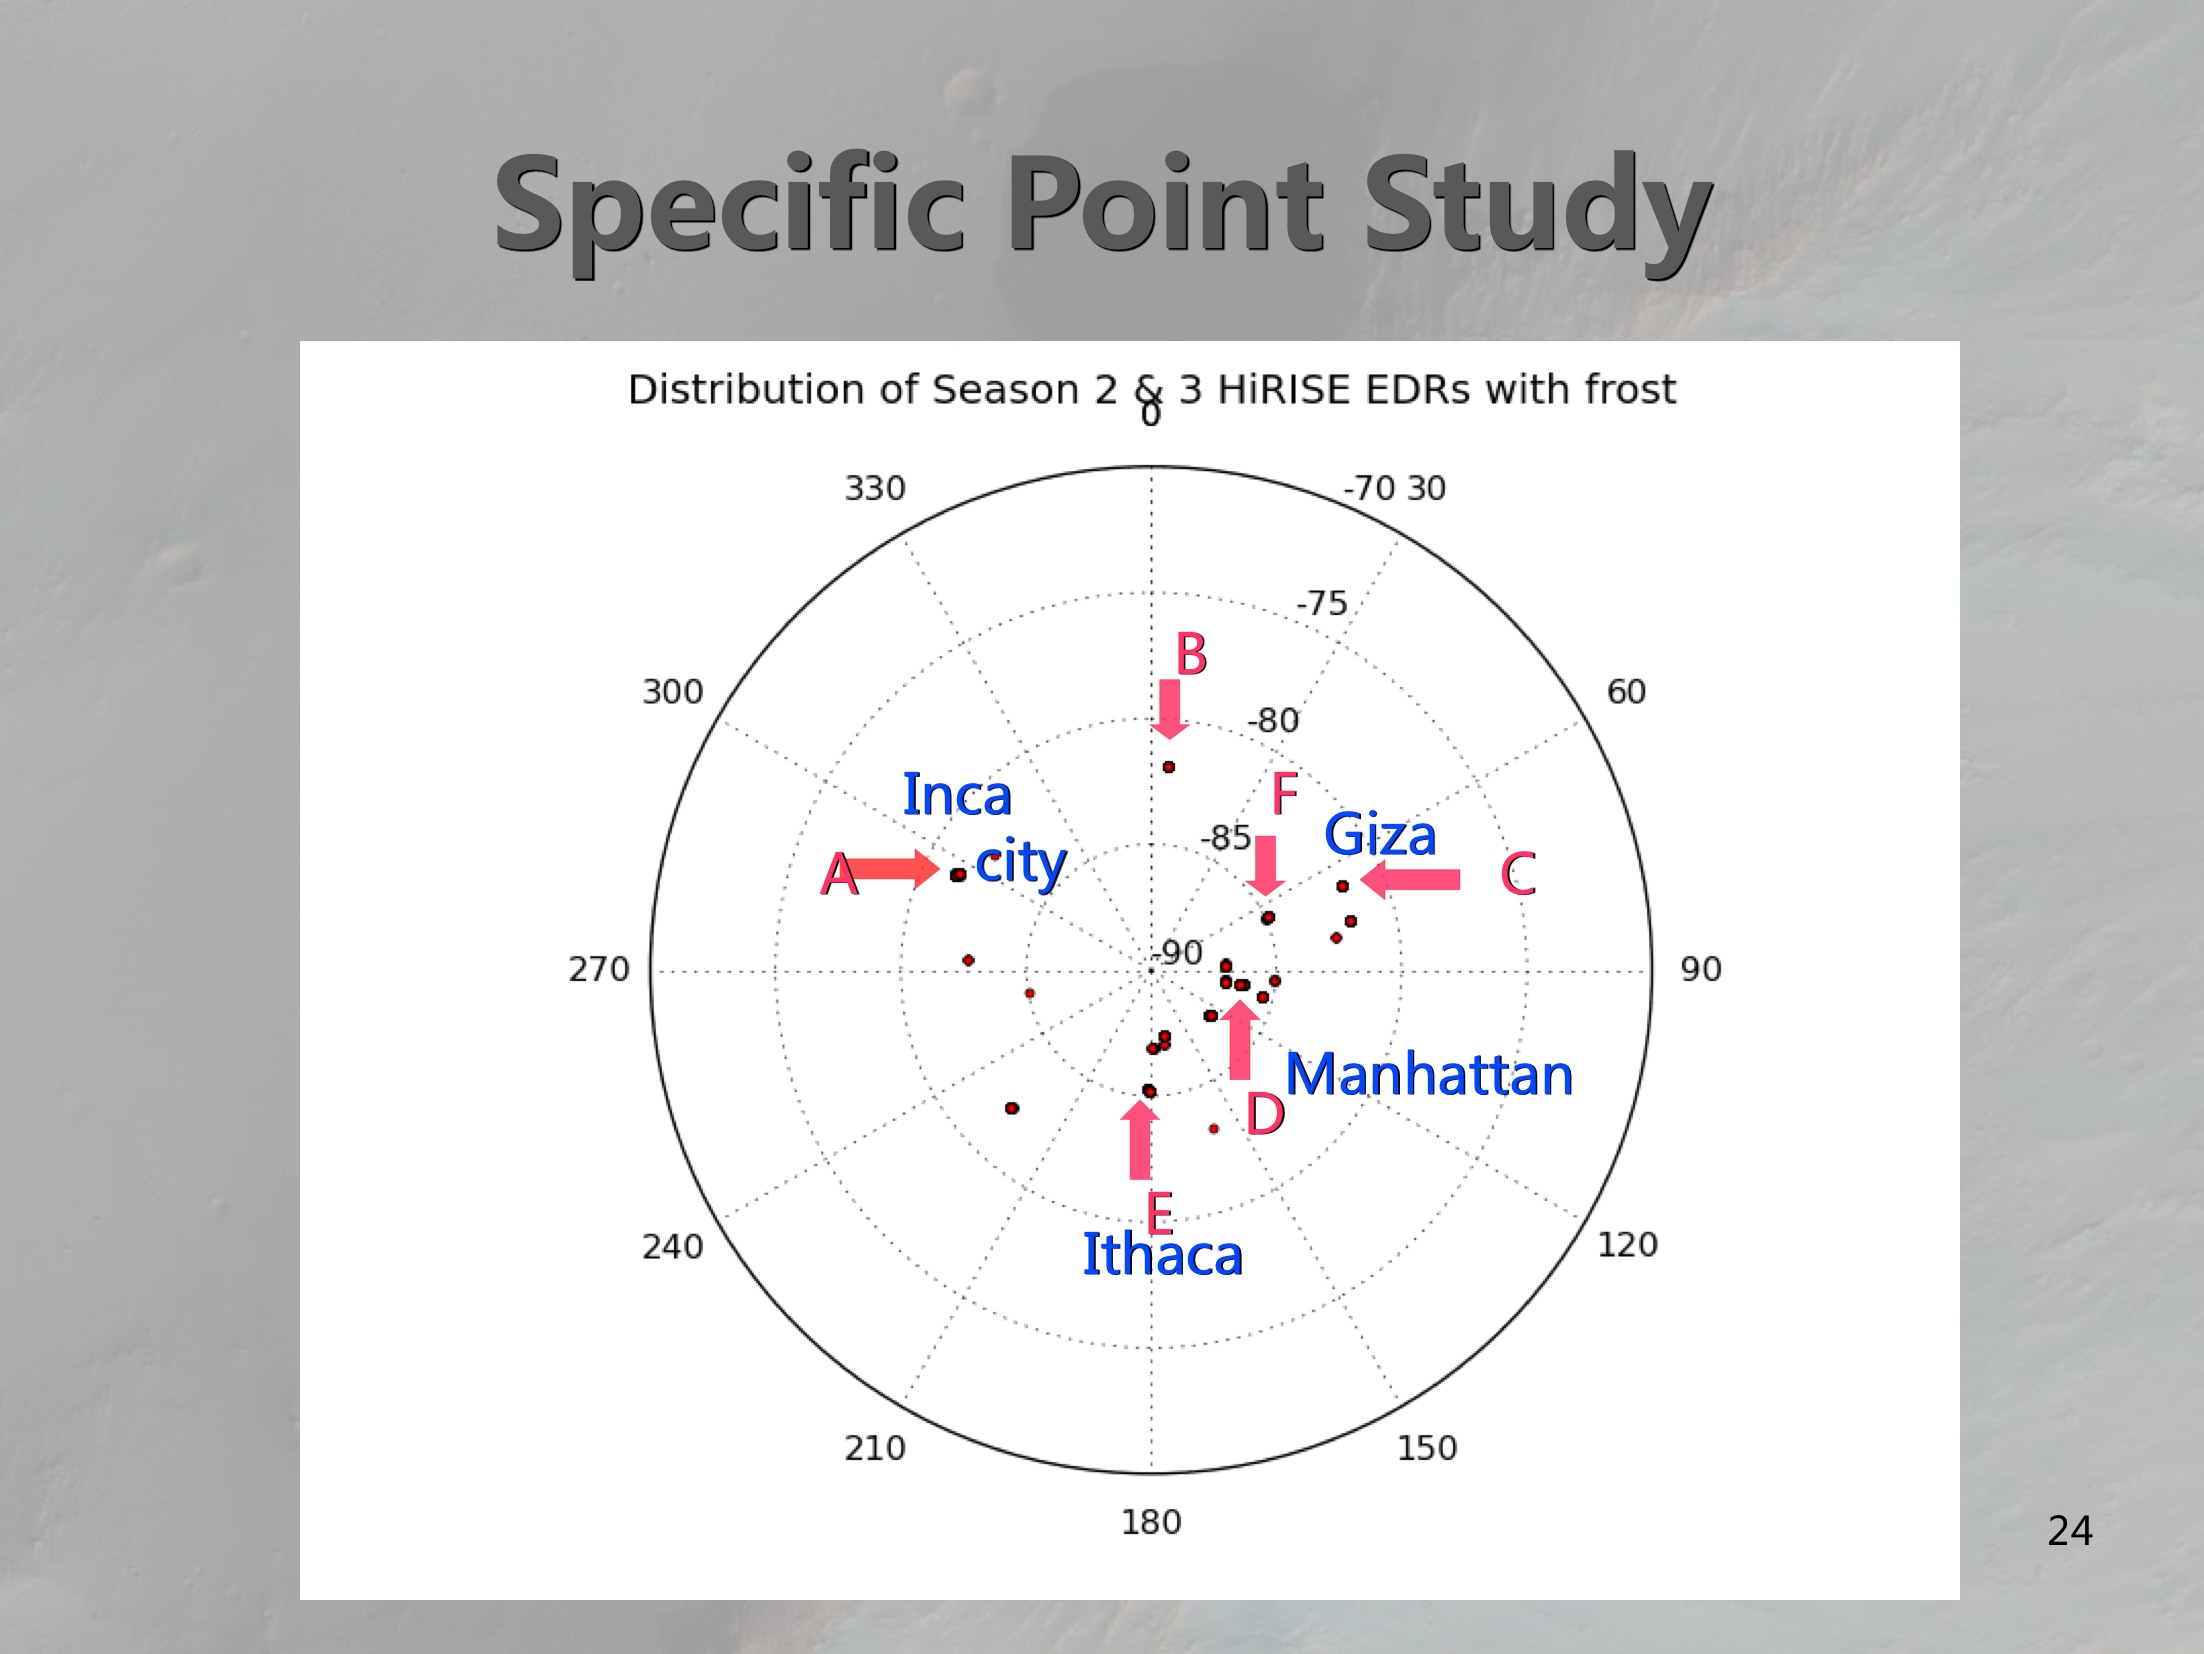 I picked 6 points of the 4 regions of interest for detailed study.
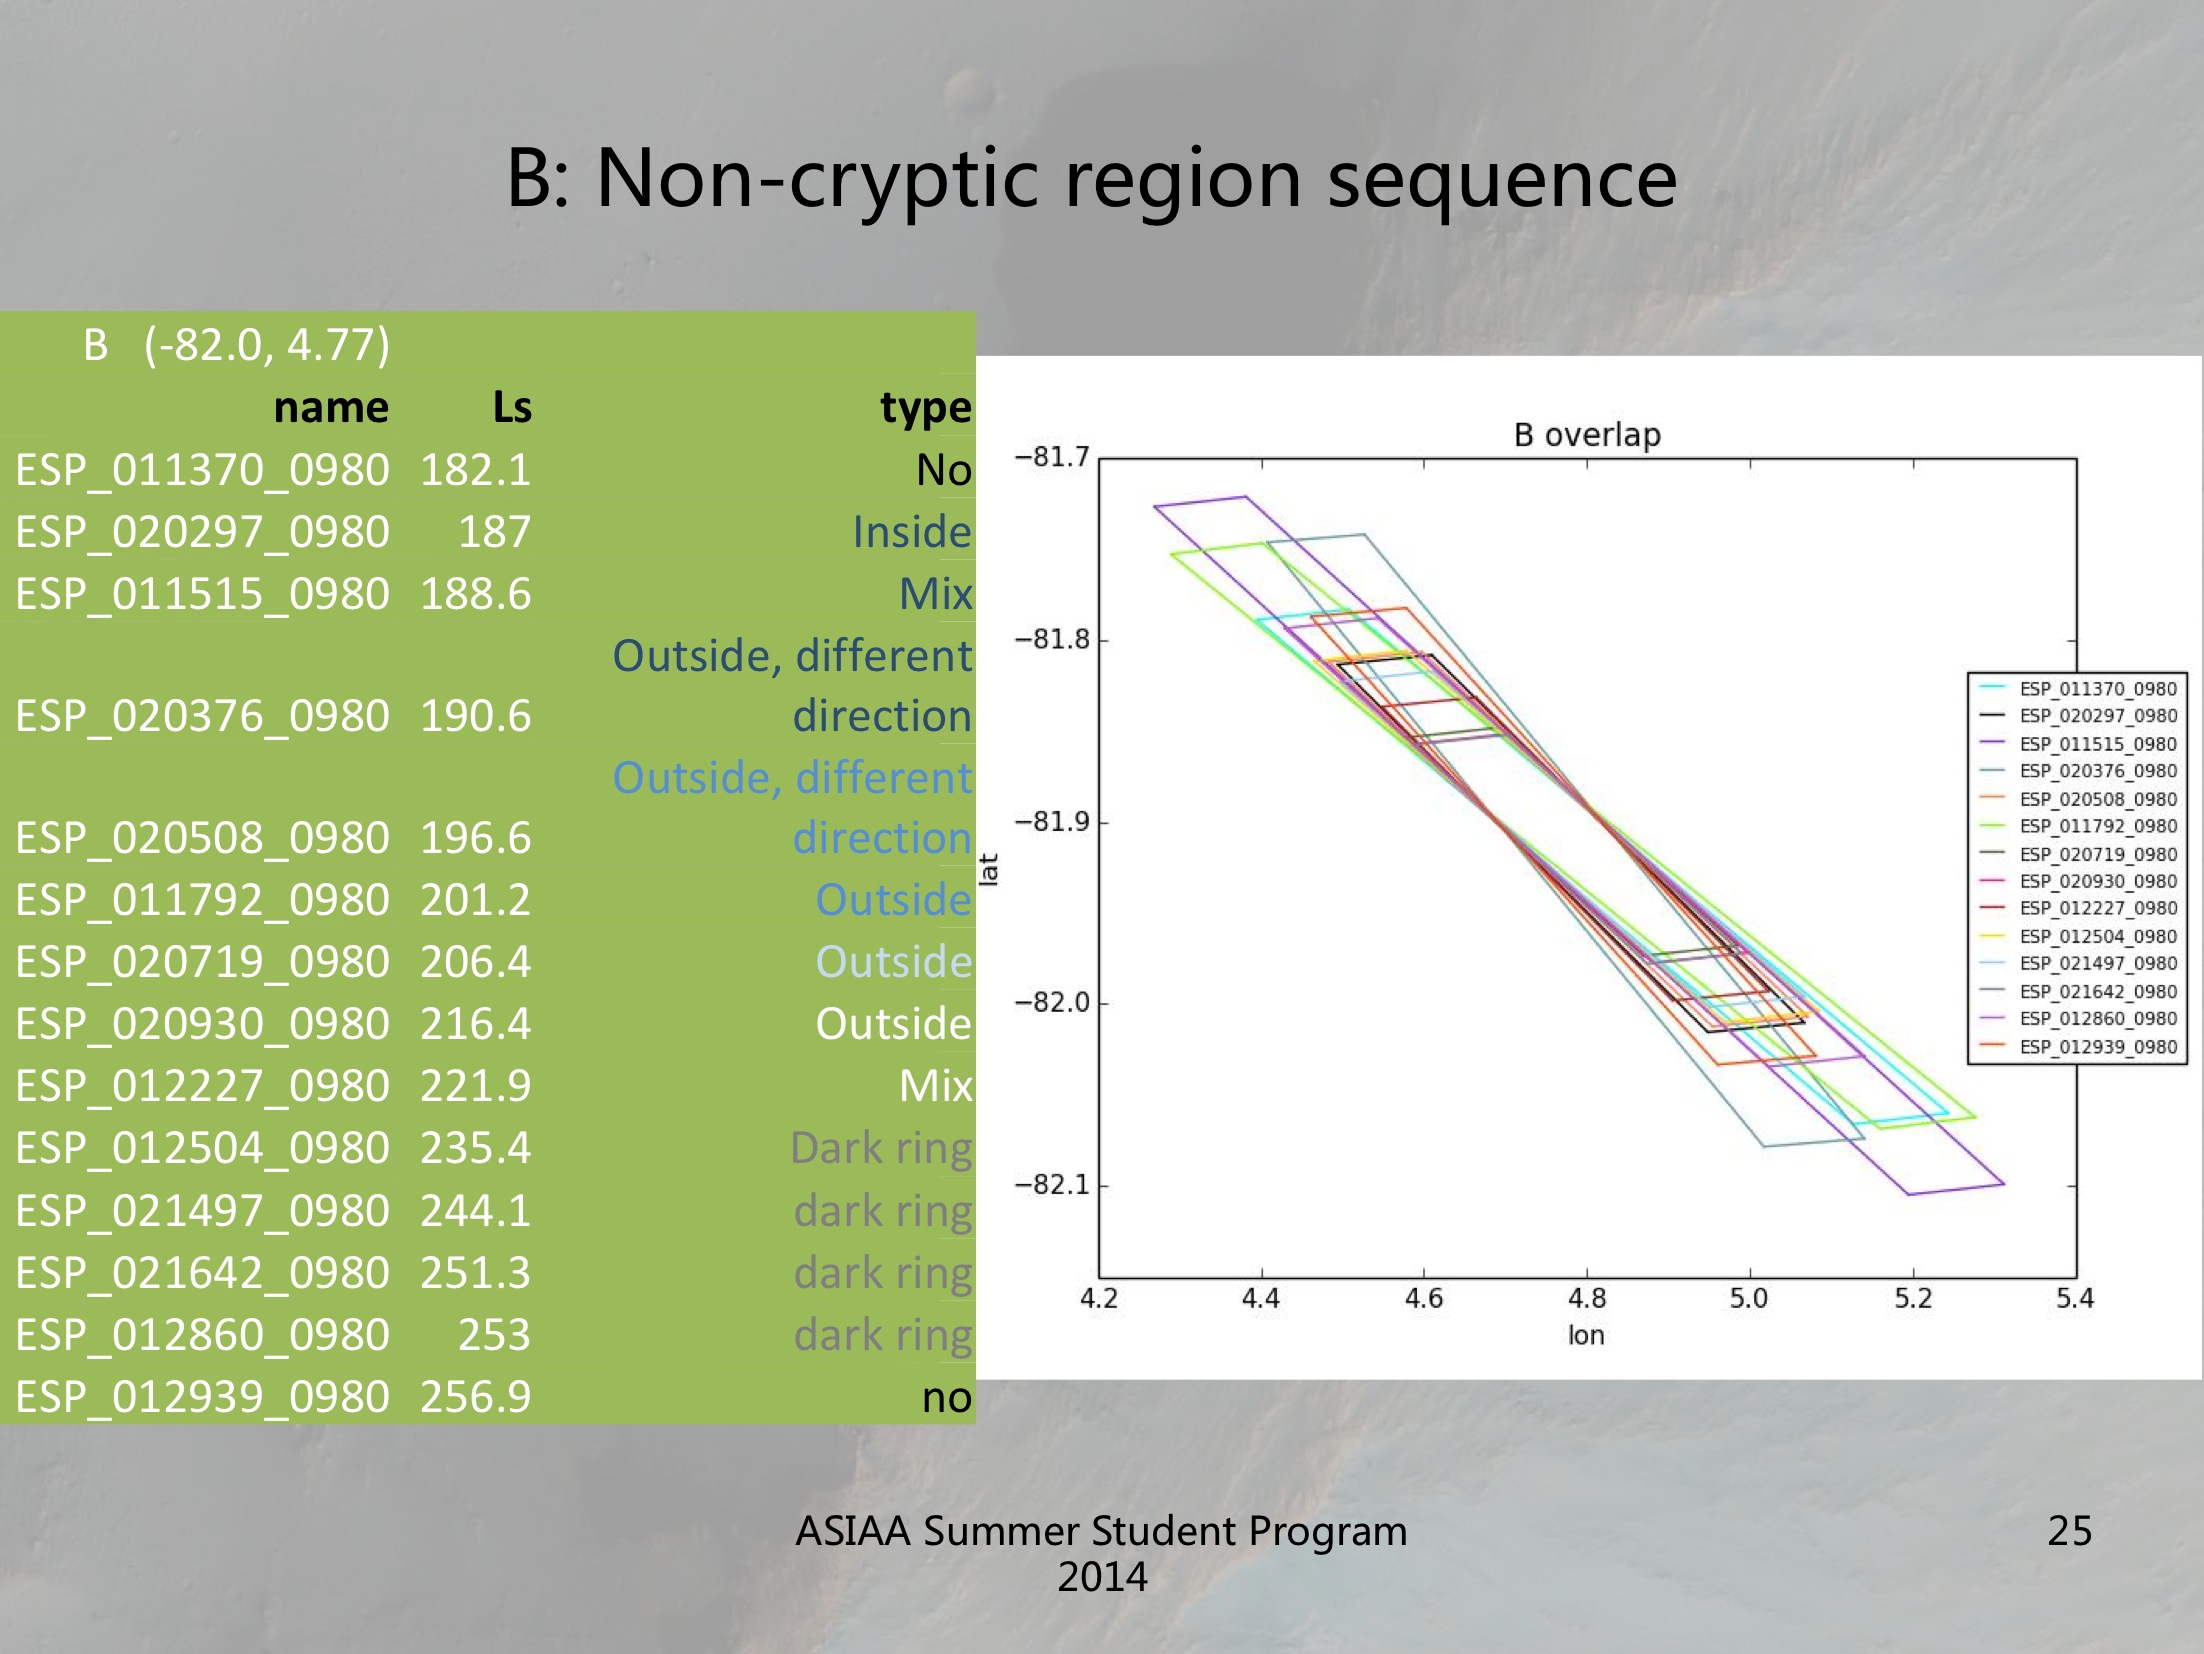 Only point B is presented since it has beautiful overlap. The table shows how the type of frost fans changes over time. Font color represents the typical color of frost or fans at corresponding time.
 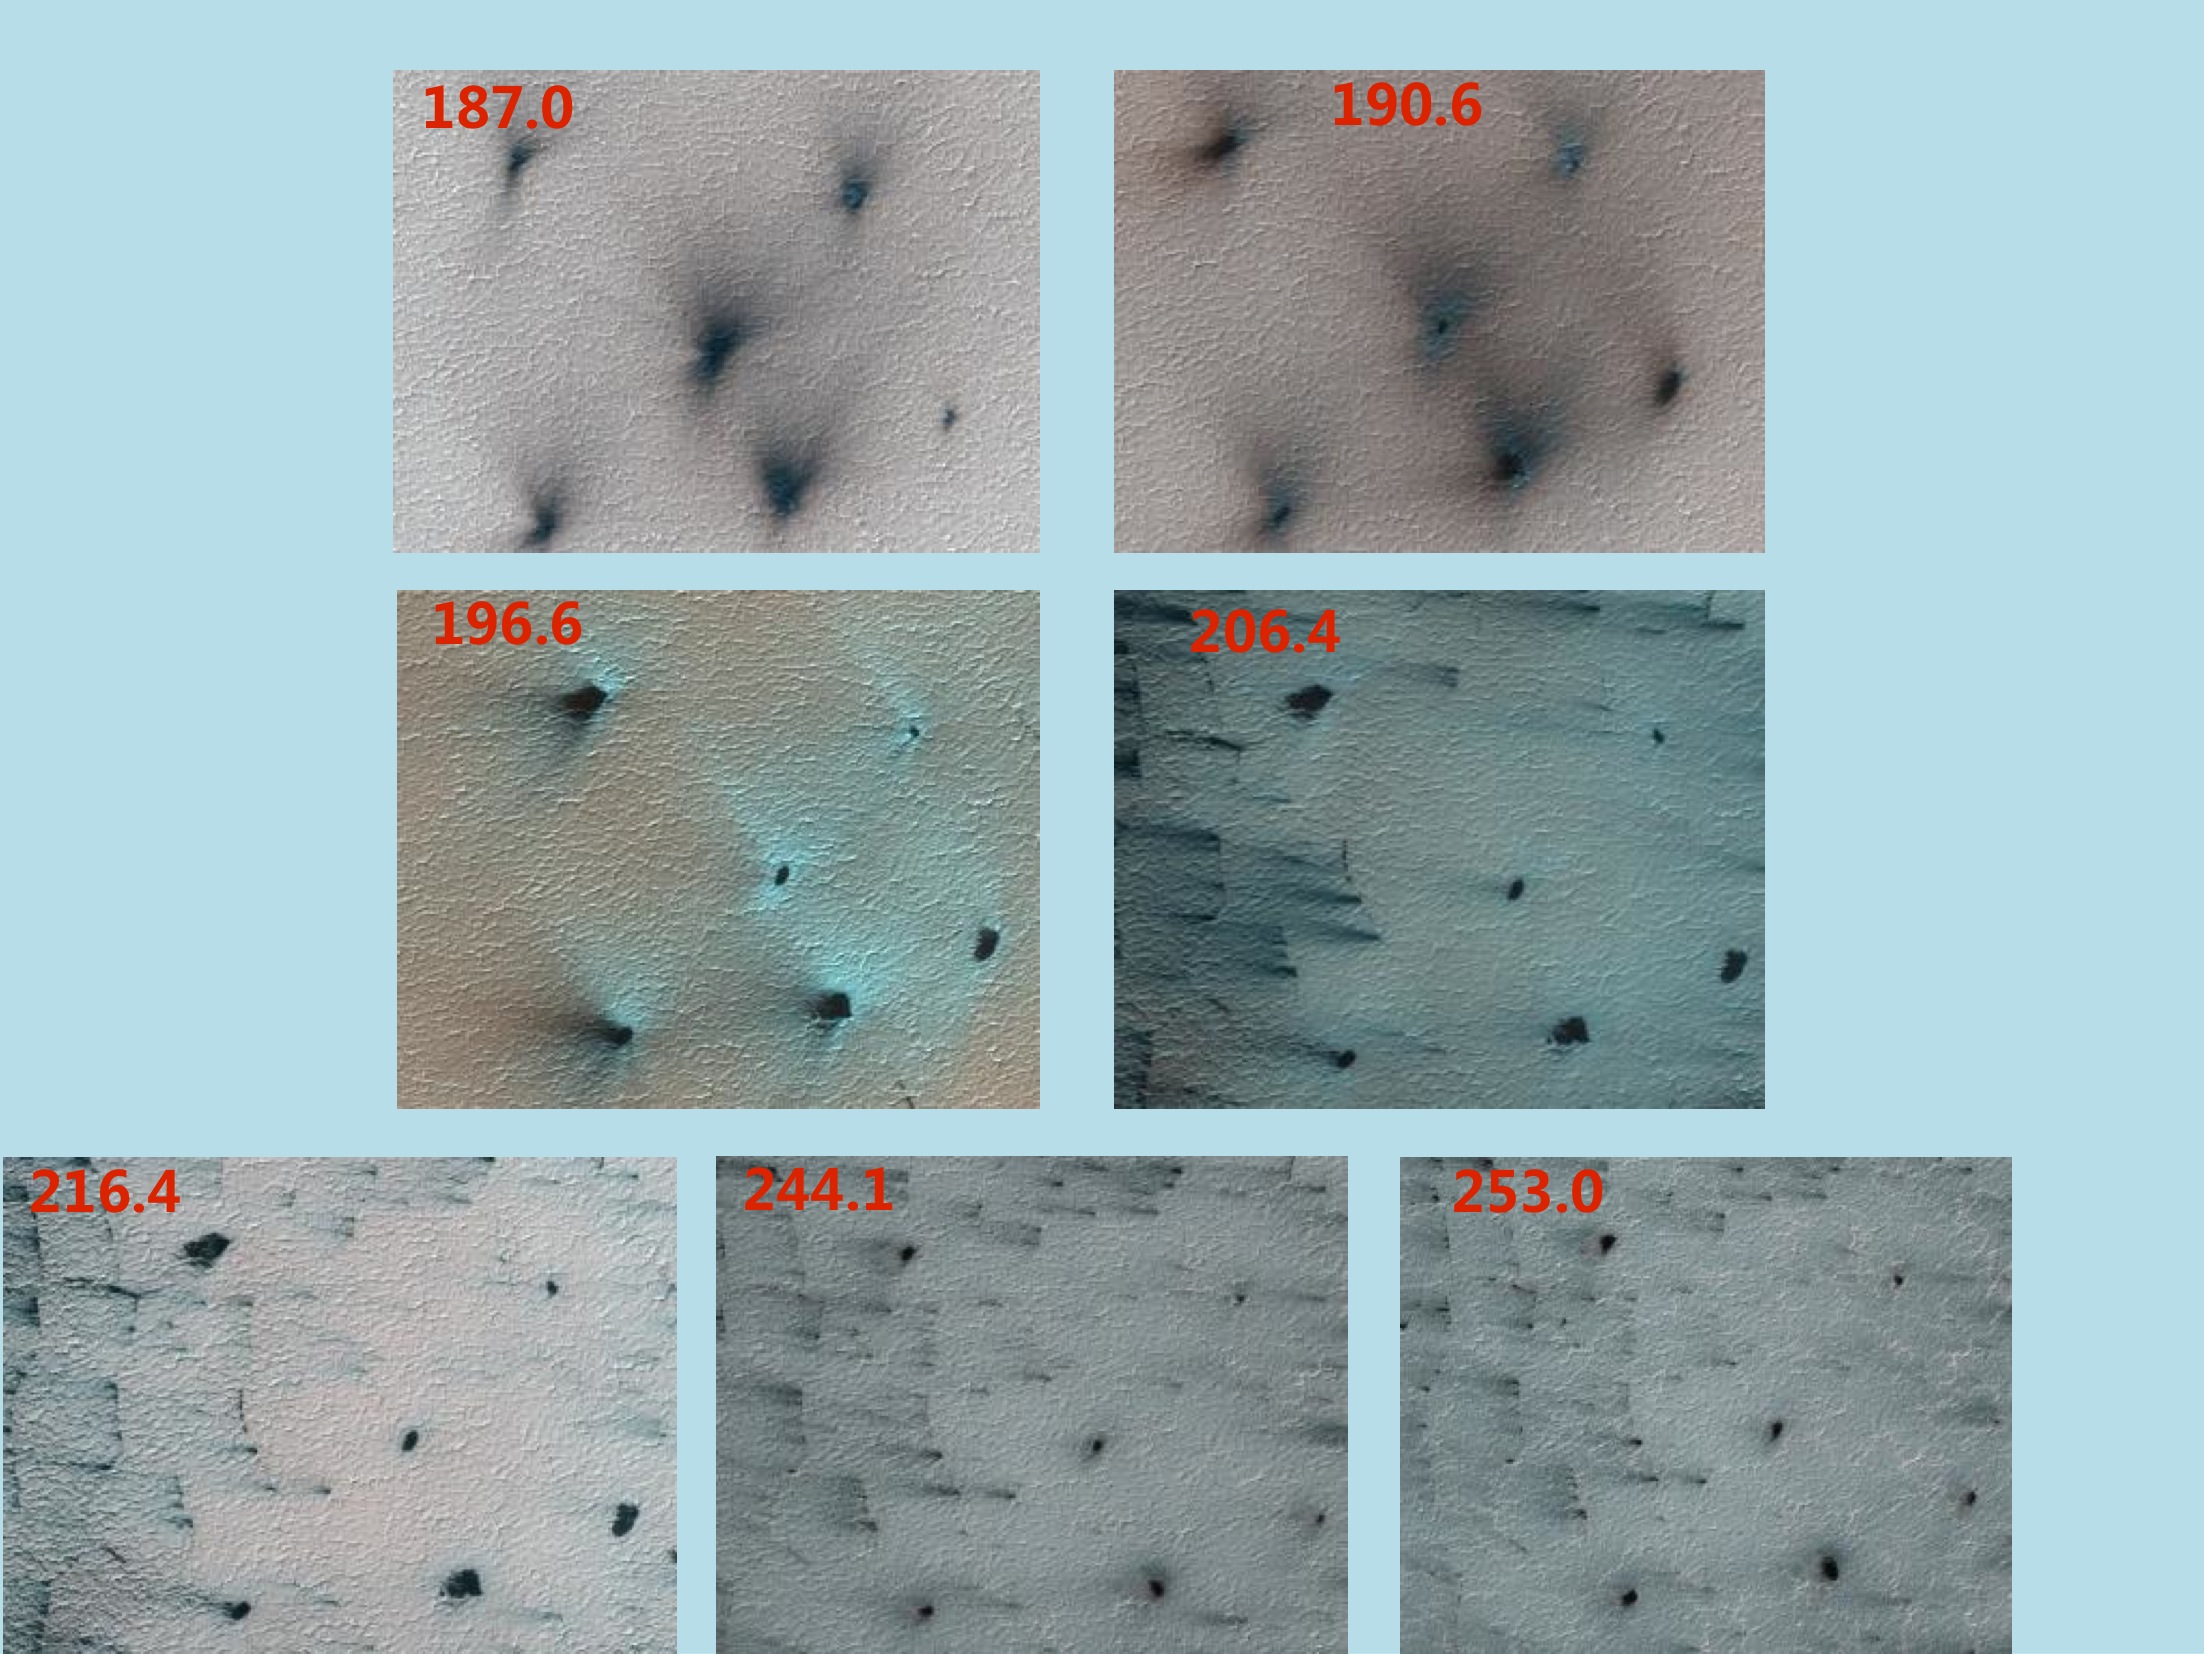 This series of pictures are of the same region. At the very beginning, nothing’s there. Gradually, we can see some dark blue stuff appear around the vents. They then expand to the outside and become bright blue. After that they begin to disappear, and the whole surface becomes white soon, with dark cores left
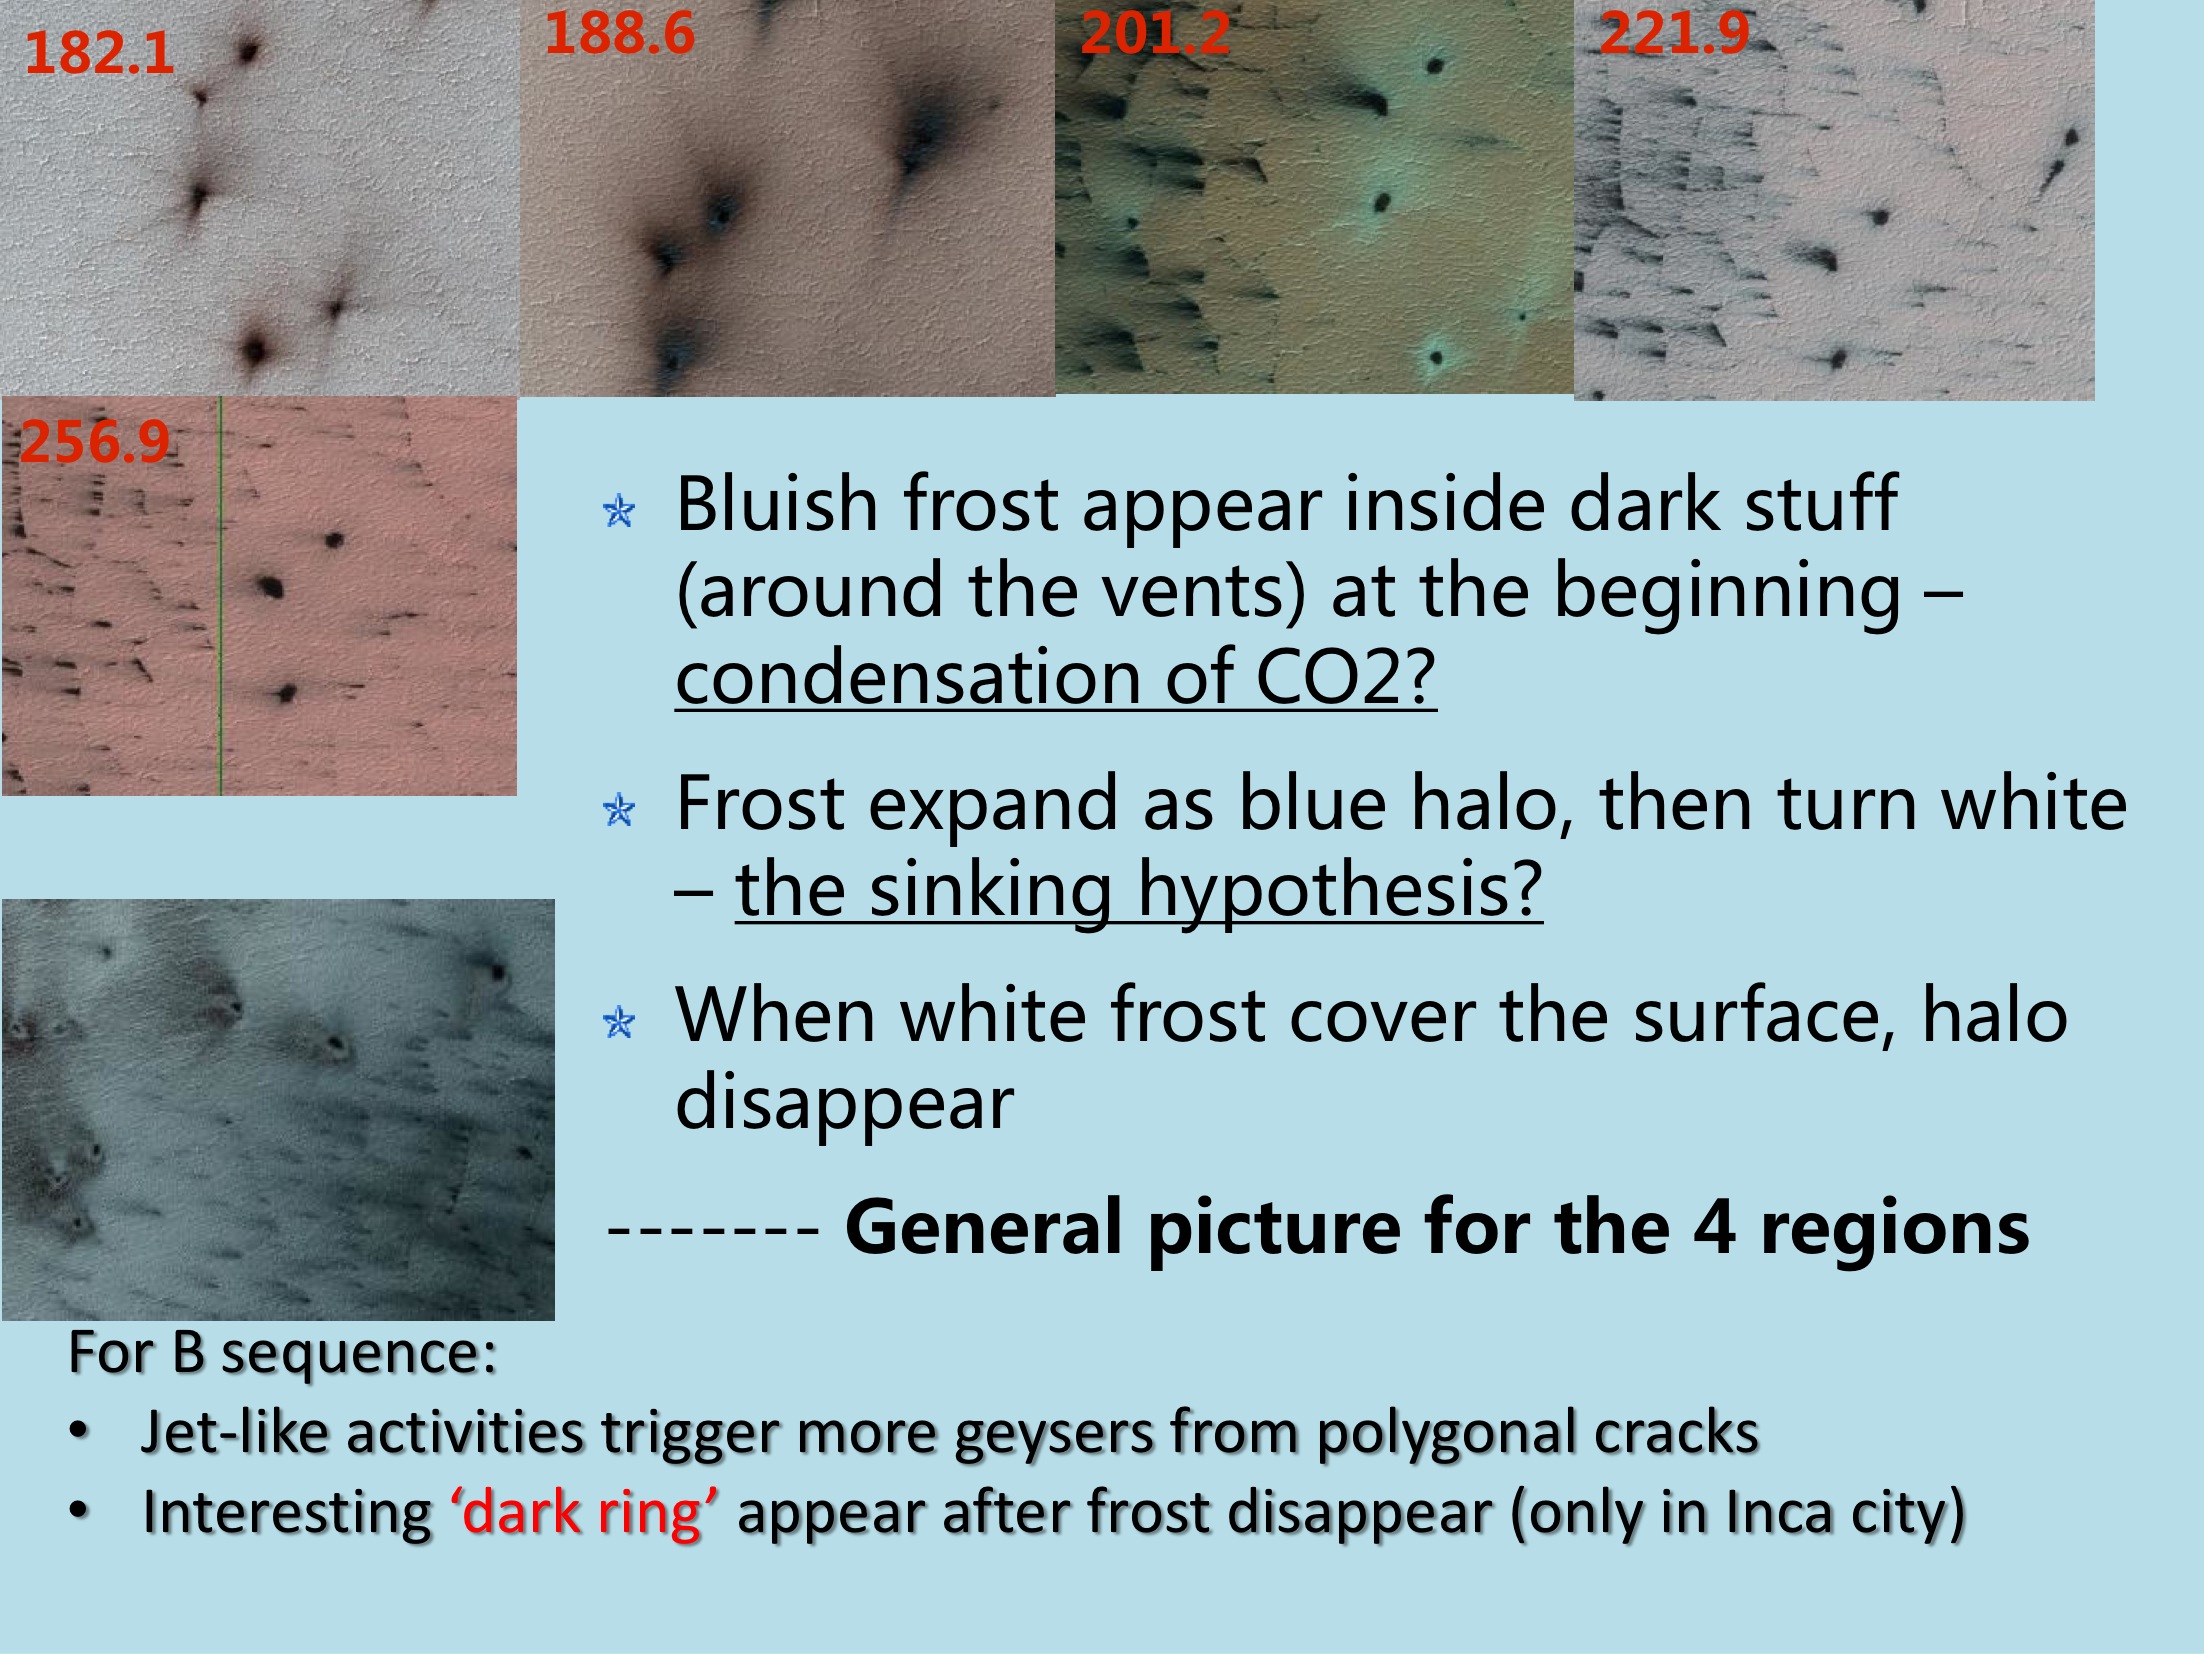 Another series show the similar process. Actually, we observe such process not just in B region. So we might have a general idea of frost evolution, as the slide shows. Interesting ‘dark rings’ are observed after frosts disappear in some places. It is the first time we see such features.
 This slide concludes my work in summer and work might do in the near future.
My Summer with Planet Four
Today we have a guest post from Chuhong Mai, an undergraduate student working on Planet Four this summer as part of the ASIAA Summer Student Program.

As a summer student at ASIAA (Institute of Astronomy & Astrophysics at Academia Sinica), I am studying seasonal processes on the South Pole of Mars with Dr.Meg Schwamb. Well, we are quite aware that fans and blotches appear and disappear on the South Pole as the seasons change. Via HiRISE on MRO mission, we can obtain unprecedented details of them but also a large amount of unprocessed data. We hope to make good use of the data in order to have a better understanding of their physical processes, yearly evolution and influence on Mars climate.
Our first problem is the position. With all the markings you’ve made on these HiRISE cut-outs, we need to know the precise locations and thus the distribution of them. The way the images you see are Planet Four are processed we can’t directly add the spacecraft information needed to calculate the latitude and longitude straight from the x and y positions from your markings. Instead I’ve written a pipeline using the Integrated Software for Imagers and Spectrometers (ISIS) to turn raw HiRISE data from Season 2 & 3 into pretty mosaics with the spacecraft information added. Now we are able to get the detailed greographic information of any point of interest. This means that the Planet Four team can now measure the actual size and shape of these fans and blotches, as well as to project them on the true surface. Once we do the time series analysis, we can have a deep look on seasonal change.
In addition, I’m also working on ‘frost fans‘, which contain pretty blue or white stuff around or in the center of themselves. They are considered to possibly be the condensation of CO2 that come out of the vents, but we actually have little knowledge of them. I’ll be examining images from Talk where volunteers have used hashtags to mark these features and seeing what I can learn about when and under what conditions these colored features appear. Perhaps the following study could reveal some clues to decode the puzzle.
Meet Chuhong
Name: Chuhong Mai
What is your current position and where/institution?
I am an undergraduate student in Sun Yat-sen University, Guangzhou, China. And now I am working as a summer student at the Institute of Astronomy & Astrophysics at Academia Sinica (ASIAA), Taiwan.
Where are you originally from/where did you grow up?
Jiangmen, Guangdong Province, China.
What are your research interests/what do you work on?
I am interested in the whole solar system, and solar systems beyond our own. For me they are places full of miracles and hopes. I’m curious about their origins, their histories and their future. Thus I work on planets, small bodies and planet formation.
Why are you interested in Mars?
Because of its mystery. I am a huge fan of science fiction, and Mars is always one of the most popular topics in sci-fi books and films. I like its red face and wonder what happened and is happening on it.
What is your favorite movie?
Contact, directed by Robert Zemeckis
What is your favorite book?
<The Three Body Problem> by Cixin LIu (It’s not a mathematics textbook but science fiction.)
What is the song you currently can’t get out of your head?
Valder Fields by Tamas Wells
What three albums would you bring with you to a desert island?
<A Plea en Vendredi> by Tamas Wells, <Europa> by Ron Korb, <A Wish to the Moon> by Joe Hisaishi.
Favorite cocktail or beverage?
Milk tea.
New address: Ithaca, (85.2S, 181.4E), Mars
We have recently started showing you data from a new location! Have you noticed?
This new place is called Ithaca. It is located at lat =-85.2, lon = 181.401. Unlike Inca City (our most recent focus), this is a flat area, no considerable slopes are present here. Ithaca is located in the middle of this elevation map:

You see, that the red area has maximum elevation change of less than 80 meters. In the absence of slopes, we can say more confidently that the fans here are result of interaction of dusty CO2 jets with winds and not gravity simply pulling sand downhill. Winds direct dust and sand particles after they are lifted up into the atmosphere by the jets. It is very striking, that the fans look very similar in several consequent years of HiRISE observations. The usual year in Ithaca looks like this:
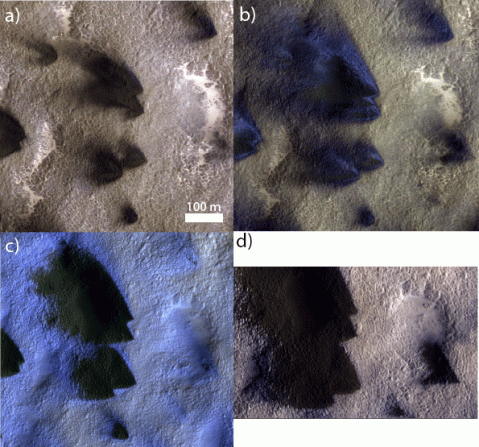
This is a mini-series of HiRISE images from early spring (a) progressing to late spring via (b) to (c) and finally to (d). Fist images that HiRISE returns each spring show large dark fans with the similar opening angles and similar directionality every year. This tells us that there is few variation in local weather from year to year.
When spring progresses, fans extend, later blue fans appear, and sometimes they take over most of the surface! Like in figure (c) – whole area is blue apart from really dark fans. This is one of the mysteries of Ithaca – we know from spectrometers, that those blue fans are fresh CO2 frost, but how comes fresh frost appears on the sides of the dark fans? Dark surface is warmer when exposed to sunlight and must prevent CO2 from forming there.
Another Ithaca mystery is its fan sizes. Here the fans grow to be huge: you see the scale bar on the first image? That is 100 m and the fans on the figure (d) are 2-3 times that long. It is larger then in most of other polar locations. For example Inca City, that must be familiar to you by now, has fans of only tens of meters. Currently scientist do not have models that is able to explain how such big fans form.
If you carefully compare left and right frames of the figure below, you can see quite some new fans appearing in the right frame.
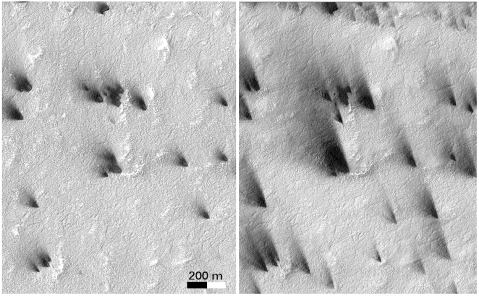
Scientists would really like to know, how many of those appear each day and how big are they compared to the old fans. In this example new fans look small, but this is only one tiny area from Ithaca. To make a clear statement we really need to count them and outline their sizes. That is why Ithaca is now waiting for you to get marking!
Enjoy!
Gold Standard Data

Image Credit: Wikimedia Commons http://en.wikipedia.org/wiki/File:Gold_Bars.jpg
We wanted to give you a quick update on what the science team is up to. We’ve been hard at work making progress towards the goal of completing the project’s first paper, thanks to your help marking the fans and blotches in the season 2 and season 3 cutouts. Fingers crossed, we aim to submit the paper to a scientific journal by the early Fall.
We’ve been working on developing the best method to combine your classifications to identify blotches and fans in the cutouts you see on Planet Four. About 30-100 people look at each cutout, and we need to combine those markings together to get the exact locations and shapes of the seasonal features. This is one of the aspects the team is thinking about, but one of the other things we’ve started working on is looking at how well the project can identify fans and blotches in the images. You might think that this is obvious just looking at the images that the dark fans pop out on the screen, but for the paper we need to prove this is true. This is important because if we want to look at how carbon dioxide geyser/jet activity changes over time, we need to be able to show that the project as a whole can really identify most of the fans and the blotches in the cutouts we show on the site.
Some of the other Zooniverse projects have compared to simulated or synthetic data that was shown and classified on the site (so they knew what the right answer was for the synthetic data) or there was already a catalog of a portion of the data that could be used to compare to. It’s difficult to make a simulated HiRISE image with fans. As you’ve seen from the images, there is so much variation in color and texture of Mars and same with the the shapes, sizes, and even color of fans that this would be likely be impossible to get just right. So what about a previously made catalog of a small subset of the data we’re showing on Planet Four? There are so many blotches and fans that no one has attempted this on a large enough scale for us to fully compare the results from Planet Four to. Planet Four really is making the first map of these dark seasonal features in the HiRISE monitoring images of the Martian South Pole. The science team didn’t even know at launch exactly how frequently in the images you’re looking at on the site that you’ll see fans and blotches. You clicks are telling us the answer.
Even if there was such a catalog of fans and blotches to compare to, it would be done in a different way (not done using the web interface we have for Planet Four) that likely has its own biases towards detection and non-detection of the seasonal features. So what do we do? Well, the science team can make our own ‘gold standard‘ dataset by classifying a small subset of the cutouts we showed for Season 2 and Season 3 (a few % of the entire Season 2 and Season 3 cutouts) in the interface and use those markings in the same way as a catalog. Candy, Anya, and Michael have stared at many many images of fans and blotches from HiRISE, and I had one of my graduate preliminary exam project on mapping the fans and blotches in images from a previous lower resolution camera (Mars Orbiter Camera – MOC). So we can argue that we should be able to identify fans and blotches reasonably well in the Planer Four images and use our markings to create a catalog which we are calling the gold standard dataset. Other Zooniverse projects, such as Snapshot Serengeti, have done something similar.
Right now, we’re going through a mostly random selection of cutouts from Season 2 and Season 3, marking the fans and blotches we see with the same classification interface on the Planet Four website. To get a large enough sample of cutouts reviewed, we’re each mainly marking different cutouts than each other, but we do have a small amount of overlap for us to compare our results to each other and understand the differences. For example, I’ve looked at less images of HiRISE fans than the rest of the science team, that might make me more liberal with my markings than say Candy or Anya. The overlap should help us understand and calibrate for those kinds of effects between the different science team markings.
It might seem like we’re testing you but we’re really testing the project. This gold standard dataset is going to help us explore and show how well Planet Four as a whole can identify the seasonal fans and blotches in the images from HiRISE. Without the analysis and comparison to the gold standard data, we would just have a catalog of fans and blotches on the surface. The comparison to the gold standard data is a really vital part of the project, and allows us to study how the Martian climate impacts the formation of the seasonal blotches and fans from Martian year to year and throughout a given season.
We’ll keep you posted about the gold standard data and our analysis as it continues to develop. Stay tuned to the blog for more updates about the paper as we get further into the Summer.
Dry ice snowfall
About a week ago our colleague and a resident polar scientist on the Mars Climate Sounder (MCS) science team Dr. Paul Hayne wrote this Planetary society blog post. He talks about CO2 snowing on Mars! If you are interested to know why we think that it snows dry ice on Mars or what shape CO2 snowflakes are, go check it out! And let us know your thoughts on how it affects the areas that you are helping us to analyze!
Anya
Aftermath of a Global Dust Storm
As we begin to approach winter in the northern hemisphere, so too does the southern hemisphere of our neighbouring planet, Mars. Set to experience its usual seasonal CO2 snowfall and lows of -125 degrees Celsius at the poles, it makes Earth seem pretty warm and cosy in comparison. This time of year sees the process of carbon dioxide beginning to ‘freeze-out’ at the southern pole, creating ice caps not unlike the ones that we are familiar with. Throughout the Martian year, the HiRISE instrument on board the Mars Reconnaissance Orbiter (MRO) captures images of the southern pole that the Planet Four community is helping to analyse. Between two seasons of imaging from the instrument a global dust storm swept across the red planet leaving a high concentration of fine grains in its atmosphere. The science team is eager to find out what effect, if any, such a large event could have on surface processes. By comparison of images previously analysed by the Planet Four community, this will hopefully lead to a better understanding of the different climate cycles and overall environment of Mars.
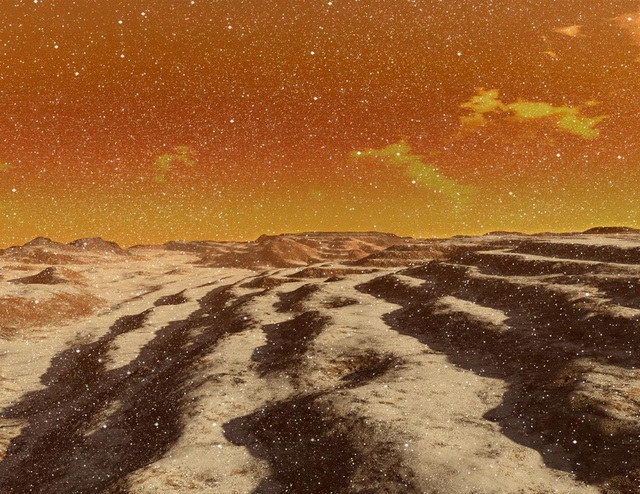
Snow storm on Mars. Image credit: Ron Miller
As you will already know, the main goal at Planet Four is to examine the size, frequency and distribution of material that bursts out from under the CO2 ice sheets as they begin to thaw in the warmer months. During the Martian spring at the southern pole, the caps start to receive more sunlight and the ice gradually sublimates back into the atmosphere. As there is no liquid phase of CO2, this means that when the ice heats it directly evolves into a gaseous state and returns into the atmosphere. Sunlight penetrates to the very bottom of the sheet, which causes the ice to transform into gas far below the surface. Since the gas is trapped and continues to form, the pressure eventually becomes high enough that it erupts through the sheet, bringing with it the underlying material which can be clearly distinguished on the surface. The sediment left behind from these geyser-like eruptions is what we analyse in the images in the form of ‘fans’ and ‘blotches’. If no wind is present the material falls straight back down under gravity and forms a blotch; where it is present, the material will be blown as it bursts out and we observe a fan shaped feature of material spanning out from its source.
Dust storms and dust devils could have an effect on this process, as the atmospheric and surface temperatures across the planet change depending on the amount of airborne material. The phenomena arise due to solar radiation heating the planet’s surface and causing convective currents which sweep up the finest grains of material into the atmosphere. As the wind interacts with suspended particles, the gusts intensify and encourage more dust into the air. If the wind rotates as it rises the speed and spin will increase, due to the conservation of angular momentum, and a dust devil is formed. Unlike the swirling bodies of sand seen on Earth, Martian devils can stand up to ten times as high and 50 times as wide due to the planet’s tenuous atmosphere and lower gravity. Most dust devils and dust storms form and dissipate within a matter of hours, but around one in every three Martian years sees a storm evolve and sweep across the whole globe, masking the surface in a dusty haze. Planet-wide dust storms are most likely to form at the equator in summer time when the most surface heating occurs and bigger temperature variations are present, before spreading across the globe. One such storm took place between periods of data acquisition by MRO; so how does this affect the images analysed by Planet Four?
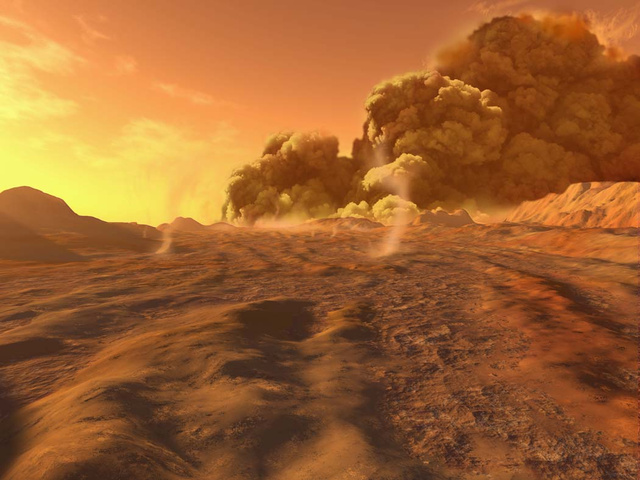
Dust storm on Mars. Image credit: Ron Miller
The global dust storm kicked up a lot of material into Mars’ thin atmosphere, where the finest grains can remain for a long period of time due to its cool and dry nature. This allowed more CO2 to condense onto the newly airborne dust, which later fell to settle and form ice sheets at the southern pole. The subsequently large amount of dust locked into the sheets following condensation will have affected the opacity of the ice, and therefore the amount of sunlight that heated its base in the spring. If less sunlight is able to penetrate the ice and heat the base layer, the whole process could have been delayed, causing eruptions to occur later in the year. As the fans and blotches are our only real indication of surface wind patterns on a large scale, whether the regions produce a similar network of marks or not is of great interest to the Planet Four team.
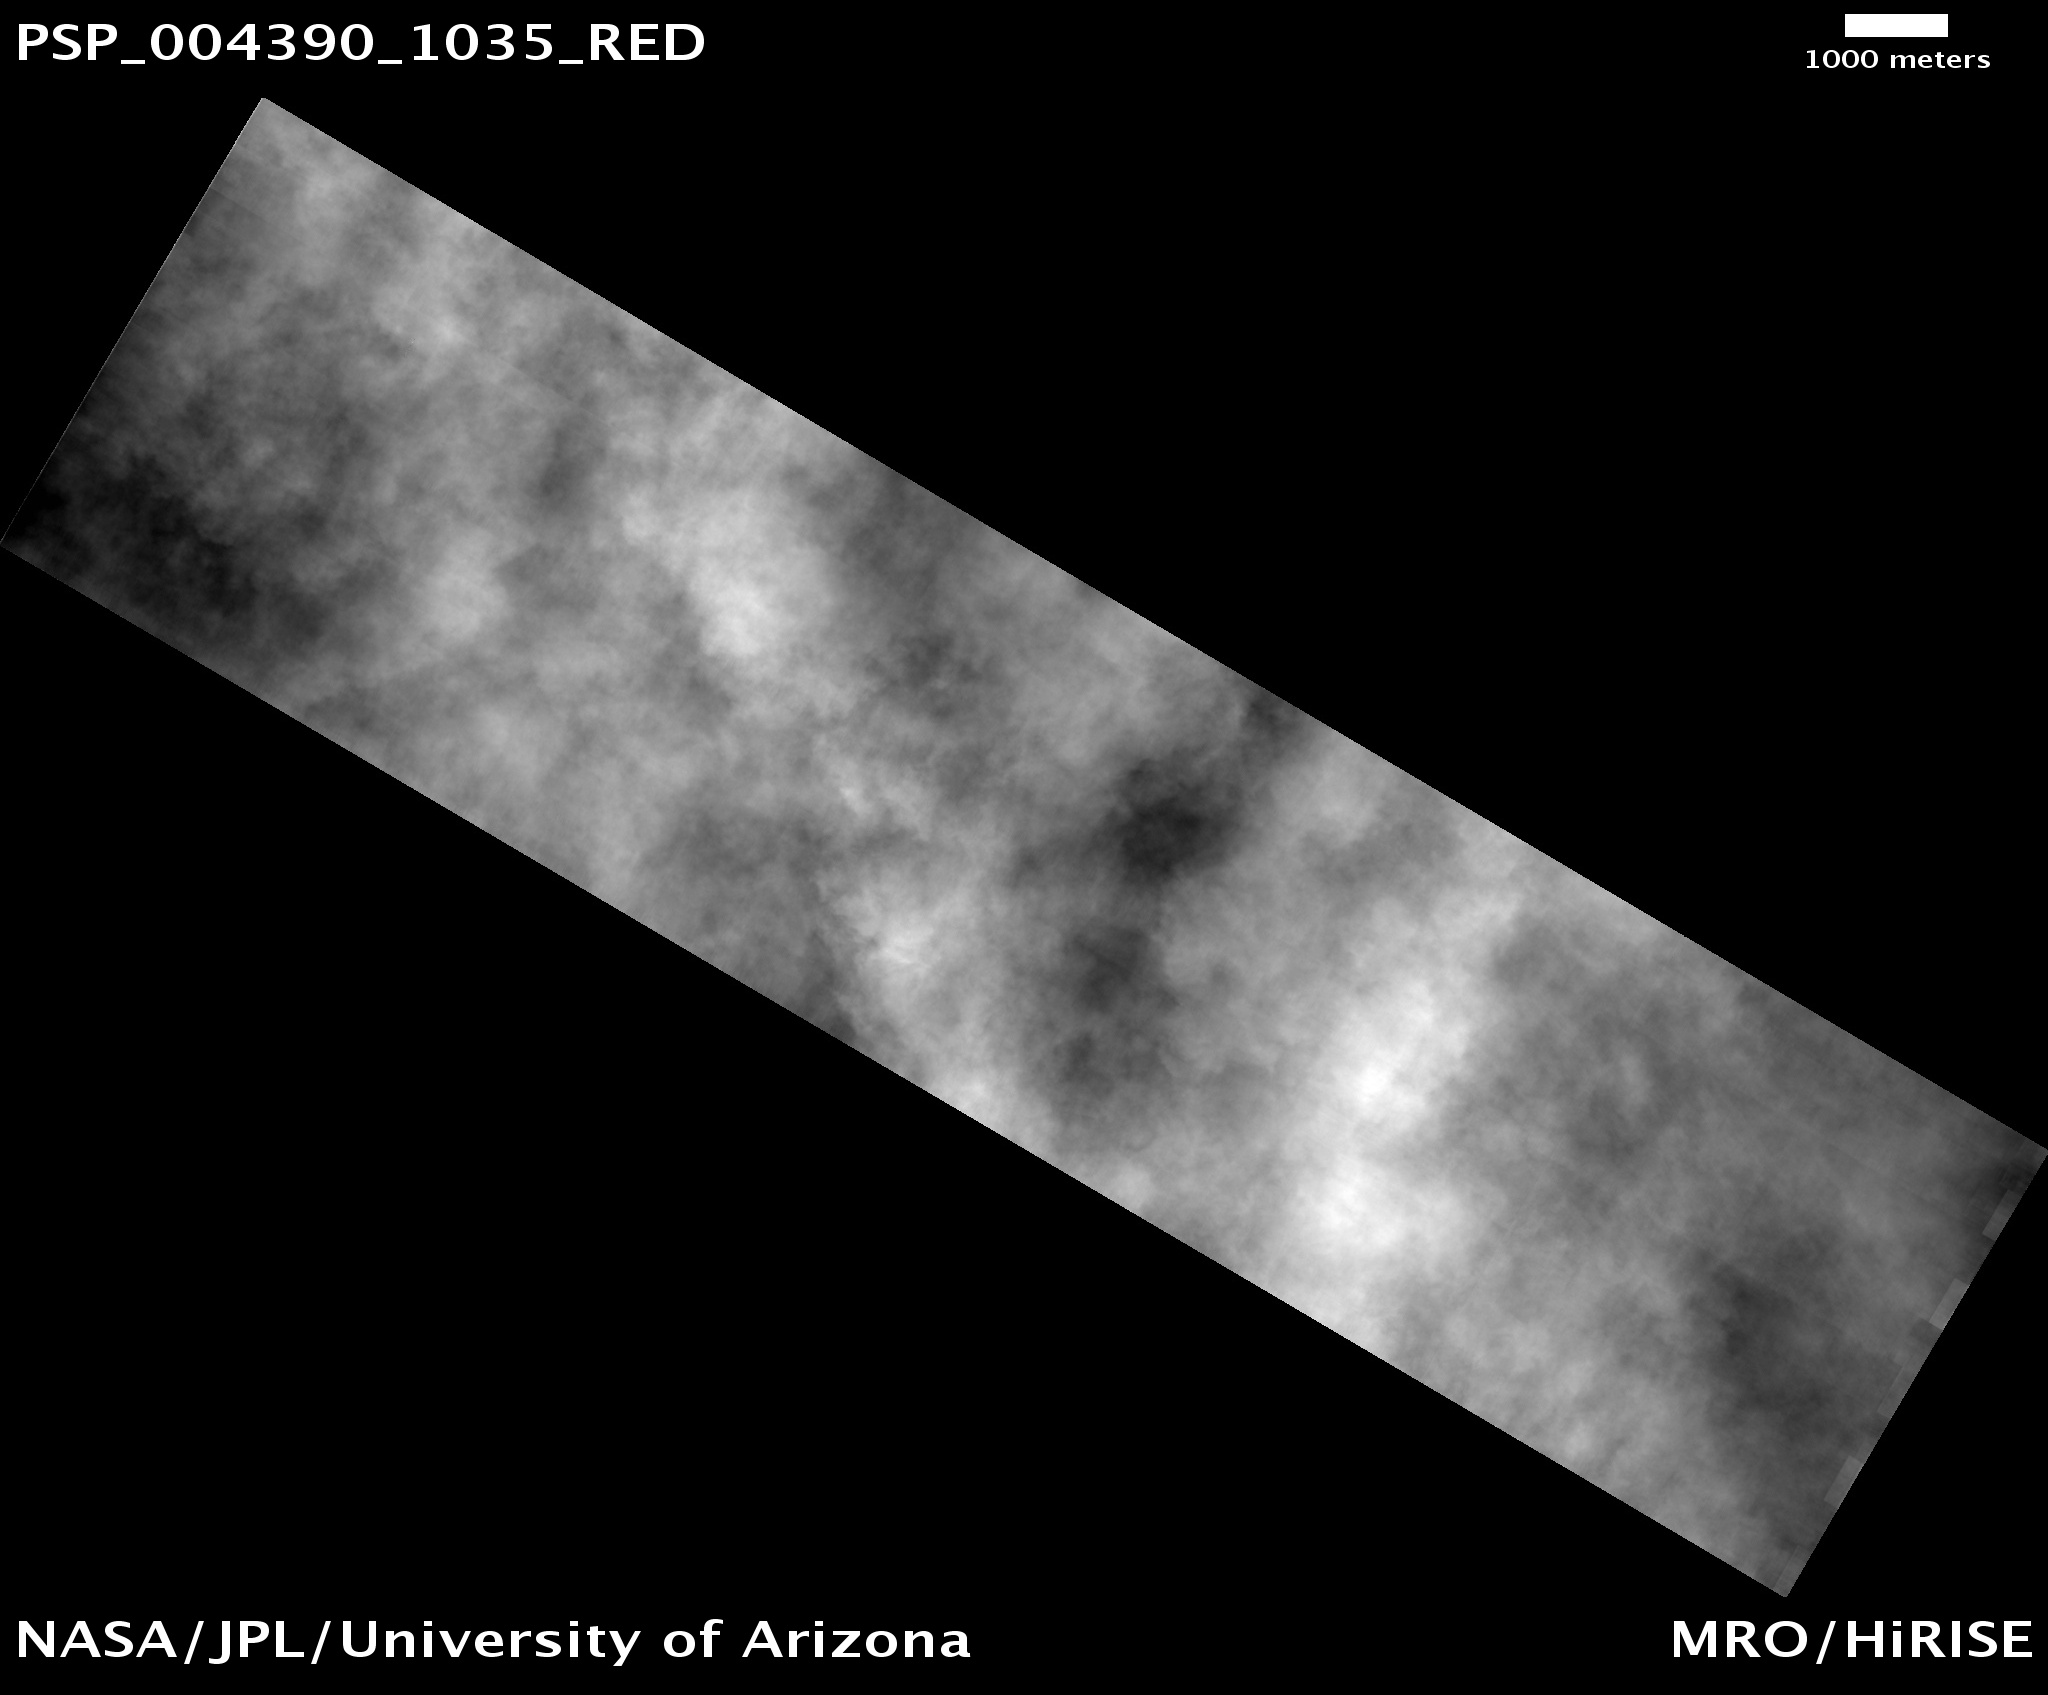
The storm took place in 2007, between seasons 1 and 2 of HiRISE imaging. The picture above captured the event, where the surface was completed obscured by the clouds of dust. Planet Four participants have already finished analysing images from seasons 2 and 3, and are currently working through those taken during season 1. It will therefore be very interesting to compare the nature of fans and blotches before the storm with the already processed images taken after the storm, as they may produce very different results.
Hopefully the data analysed will provide a clearer picture of how the two dominant cycles on Mars, dust and carbon dioxide, are interlinked. In turn, this should help to build our overall knowledge of the mysterious Martian climate. Please keep clicking and bring us closer to achieving this goal!
The Planet 4 Invasion – ZooCon 13 Talk
A few months ago, the Zooniverse hosted ZooCon 13 at the Zooniverse UK HQ in Oxford. I was invited to give a talk virtually about the status of Planet Four and the science behind it. Our own Talk moderator Andy Martin was in attendance and wrote a summary post about the day. My talk is online and you can find it below (the first 30-45 seconds is cut off but the rest of it is all there).
